

Let’s get one thing straight: measurement isn't a chore you do just to justify your budget. It's the engine that powers your company’s growth. Launching a campaign without clear metrics is like flying blind. Sure, you're burning fuel, but you have no clue if you're actually getting closer to your destination or flying straight into a storm.
Why Measuring Marketing Effectiveness Is Your Growth Engine
So, what do we actually mean by "measuring marketing effectiveness"? Simply put, it's about figuring out how well your campaigns are hitting their targets. It’s the difference between guessing and knowing. Without it, you can't be sure what’s working, what's a waste of time, and where to put your money for the best possible returns.
Think of your marketing like an orchestra. Each channel—social media, email, SEO—is an instrument. If you only listen to the overall noise, you’ll never know if the violins are out of tune or the percussion is completely off-beat. Proper measurement lets you isolate each instrument's performance, making sure every part works together to create a symphony of business growth.
Connecting Actions to Outcomes
The real goal here is to draw a straight, undeniable line from a specific marketing action to a real-world business result. This is all about answering the tough questions that actually guide your strategy:
- Which channels are bringing in our best customers? Knowing this tells you where to double down and what to cut back on.
- Are we generating quality leads or just making noise? This helps you distinguish vanity metrics like 'likes' from meaningful results like qualified leads and sales.
- What’s our actual return on ad spend? This clarifies the financial impact, proving that every pound you put into advertising is bringing back tangible revenue.
This kind of data-first approach shifts marketing from being seen as a cost centre to a predictable driver of revenue. Take L'Oréal, for example. The cosmetics giant famously pivoted its budget during the pandemic. As e-commerce demand exploded, the company boosted its digital ad spend from 50% to over 70% of its total budget. By doing this, they aligned their investment directly with where their customers were, capturing a massive wave of online sales.
"Measuring success and allocating budget are two sides of the same coin. In order to make wise budget allocation decisions, we must understand which efforts have been successful and which have not."
At the end of the day, measuring your marketing isn't just about creating reports to look back on. It’s about building a clear, data-backed roadmap for the future. It’s what allows you to adapt, optimise, and consistently prove marketing's immense value to the business.
Choosing Metrics That Actually Drive Business Goals

So, are you tracking the right numbers? The line between a campaign that soars and one that sinks is often drawn by the metrics you choose to watch. Picking the right Key Performance Indicators (KPIs) is like giving your marketing team a compass; it makes sure every pound spent and every hour worked is pointing directly towards your true north: business growth.
This isn’t about drowning yourself in an endless sea of data. It’s about being deliberate. It’s about aligning what you measure with what you’re actually trying to achieve. Think of it like this: if your goal is to build a skyscraper, you wouldn't measure your progress by counting the number of bricks you've laid. You’d measure the height of the structure. In the same way, your marketing metrics have to reflect your big-picture goals, not just the day-to-day hustle.
Too many businesses get bogged down trying to connect their marketing spend to tangible results. They fall into the trap of vanity metrics—things like social media followers or page views. Sure, they look impressive on a report, but they don't necessarily put money in the bank. While they might give you a hint about brand reach, they don't tell the whole story. The real trick is to look past these surface-level figures and focus on the numbers that truly prove your marketing is working.
Aligning KPIs with Your Marketing Funnel
To build a dashboard that actually means something, it helps to group your metrics by their purpose. Most marketing objectives slot neatly into one of four key stages, and each one has its own set of vital signs. A solid marketing strategy for your small business should have clear KPIs for every single stage.
- Awareness: Getting your brand in front of new faces.
- Lead Generation: Turning that initial flicker of interest into a potential customer.
- Customer Acquisition: Converting those interested leads into paying customers.
- Loyalty & Retention: Keeping customers coming back and turning them into fans.
By breaking things down this way, you get a much clearer picture of how effectively you’re guiding people on their journey, from first discovering your brand to becoming its most vocal supporters. This framework stops you from unfairly judging a top-of-funnel awareness campaign by bottom-of-funnel sales figures, giving every activity a fair and relevant way to be measured.
Key Metrics for Each Business Objective
Let's cut through the noise and figure out which numbers really matter for each of your strategic goals. Instead of getting overwhelmed, focus on one or two primary metrics for each objective, then back them up with a few secondary indicators.
Building Brand Awareness
Here, your main job is to achieve reach and recognition. You need to know how many people are seeing your brand and whether it's sticking in their minds.
- Primary Metric: Impressions. This is the raw total of how many times your content was shown to someone.
- Secondary Metrics: Social Media Reach (the unique number of people who saw your post) and Website Traffic (the total number of visits to your site).
Generating Leads
Now the focus shifts from eyeballs to action. The goal is to get contact details from people who've shown they're interested.
- Primary Metric: Cost per Lead (CPL). This tells you exactly how much you're spending to get one new lead, giving you a sharp insight into your campaign's efficiency.
- Secondary Metrics: Conversion Rate (the percentage of people who take the action you want, like filling out a form) and the Total Form Submissions.
It’s not enough to just measure the final sale. You have to track the steps along the way to see where people might be getting stuck. Think of it as finding the bottlenecks in your marketing funnel.
This approach lets you diagnose problems before they become disasters. A ton of impressions but a sky-high CPL might suggest your targeting is off. A terrible conversion rate could mean your landing page needs work. Understanding how these metrics play together is the secret to measuring your marketing effectiveness properly.
Data from 2025 shows that UK businesses have clear priorities. A huge 54% of UK companies said their main goal was to increase sales revenue. This made sales the top metric for 22% of businesses, with social media engagement (20%) and website traffic (18%) following closely behind.
Key Marketing Metrics by Business Objective
This table breaks down the most valuable marketing metrics based on their primary strategic goals, helping you choose the right KPIs for your campaigns.
| Business Objective | Primary Metric | Secondary Metrics | % of Businesses Prioritising This Metric |
|---|---|---|---|
| Build Brand Awareness | Impressions | Social Media Reach, Website Traffic | 18% (as Website Traffic) |
| Generate Leads | Cost per Lead (CPL) | Conversion Rate, Form Submissions | 20% (as Social Media Engagement) |
| Acquire New Customers | Customer Acquisition Cost (CAC) | Return on Ad Spend (ROAS), Sales Revenue | 22% (as Sales) |
| Foster Loyalty & Retention | Customer Lifetime Value (CLV) | Repeat Purchase Rate, Churn Rate | N/A (Often an internal focus) |
Choosing your metrics from this kind of strategic breakdown ensures you're always focused on what moves the needle.
Acquiring Customers & Fostering Loyalty
This is where marketing proves its worth in pounds and pence, turning effort directly into revenue and long-term value.
- Primary Metric: Customer Acquisition Cost (CAC). This is the all-in cost of your sales and marketing efforts to win a single new customer.
- Secondary Metrics: Customer Lifetime Value (CLV) and Return on Ad Spend (ROAS). A healthy business model is simple: your CLV must be much higher than your CAC.
When you tie your KPIs directly to your business objectives, you transform your marketing dashboard from a collection of vanity numbers into a genuine strategic command centre. This focused approach means every metric you track gives you a clear signal, helping you make smarter decisions that drive real, measurable growth.
How Technology Changed the Marketing Measurement Game

It wasn't that long ago that measuring whether a marketing campaign actually worked was more art than science. It was a world of educated guesses, painstakingly slow market research, and a healthy dose of crossing your fingers.
Marketers would spend a fortune on a glossy magazine spread or a TV advert, then wait weeks, trying to connect that spend to a slight bump in sales. It was like trying to navigate the Atlantic with a hand-drawn map and a temperamental compass; you hoped you were heading in the right direction, but you could never really be sure.
Then, digital tools arrived and changed everything. Suddenly, we had a real-time GPS. This shift from slow, assumption-based methods to the agile, data-rich world we live in today is one of the biggest leaps marketing has ever taken. We’ve moved from guesswork to genuine precision.
This isn’t just about having more data; it's about having the right data, right when you need it. For anyone new to this, a solid beginners guide to digital marketing can show how these tools are the bedrock of any modern campaign. The real breakthrough is being able to link a specific action—like a click on an email or a share on social media—directly to a business result.
The Rise of Marketing Information Systems
At the heart of this evolution is the Marketing Information System (MkIS). The best way to think of an MkIS is as the central nervous system for all your marketing. It doesn't just collect raw data; it intelligently organises and makes sense of information from every customer touchpoint, giving you a single, unified view of your marketing universe.
A good MkIS pulls together all sorts of different data streams to build that complete picture. This often includes:
- Website Analytics: Watching how users behave, where they come from, and which paths they take to convert.
- Customer Surveys: Getting feedback straight from the horse's mouth on brand perception and customer happiness.
- Sales Data: Connecting the dots between marketing campaigns and the revenue they actually generate.
- Social Media Monitoring: Keeping an eye on brand mentions, public sentiment, and engagement trends.
By weaving these threads together, an MkIS helps you see the bigger picture. You can stop looking at individual channel metrics in isolation and start understanding how your entire strategy is working together. It turns a chaotic jumble of numbers into a clear story about your customers.
From Raw Data to Actionable Insight
Of course, collecting data is one thing; knowing what to do with it is something else entirely. This is where concepts like database marketing and data mining come into their own. Database marketing is all about using your customer data to deliver communications that are personal and genuinely relevant. Instead of blasting everyone with the same message, you can tailor your offers based on their past purchases or browsing habits.
Data mining takes this a step further. It’s the process of digging through huge datasets to find hidden patterns and predictive insights you'd never spot otherwise. For example, data mining might reveal that customers who buy product A are 75% more likely to purchase product B within the next 30 days. That’s an incredibly powerful bit of insight, allowing you to set up timely, automated campaigns that feel helpful rather than intrusive.
The Marketing Information System (MkIS) is the linchpin of modern measurement, pulling together data from surveys, analytics, and direct observation. With the help of database marketing and data mining, UK marketers can now link their activities directly to business outcomes, making budget allocation sharper and more effective.
This level of deep analysis gives us unprecedented clarity. We can now draw a straight, clear line from a single action—like a click on a targeted Facebook ad—all the way through to a final sale. It makes our work more accountable, our strategies more agile, and our results far more predictable. Technology didn't just give us better tools; it fundamentally changed how the game is played.
Understanding Marketing Attribution Models
So, a customer makes a purchase. Who gets the credit? Answering this question is what marketing attribution is all about. Real, effective measurement isn't just about knowing that you made a sale; it’s about understanding the entire journey that led the customer to that point.
Think of it like a football team scoring a goal. Does all the praise go to the striker who kicked the ball into the net? What about the midfielder who threaded the perfect pass through the defence, or the defender who started the whole play by winning the ball back? Giving all the credit to that final touch is a massive oversimplification. It completely ignores the crucial teamwork that made the goal happen in the first place.
Marketing attribution models are simply the different rulebooks we can use to share the credit for a conversion across all the marketing touchpoints a customer interacted with. Choosing the right model is absolutely critical for measuring your marketing effectiveness accurately. It directly influences how you value each channel and, ultimately, where you decide to spend your budget.
This infographic simplifies how that process works, showing the flow from raw data all the way to real business decisions.
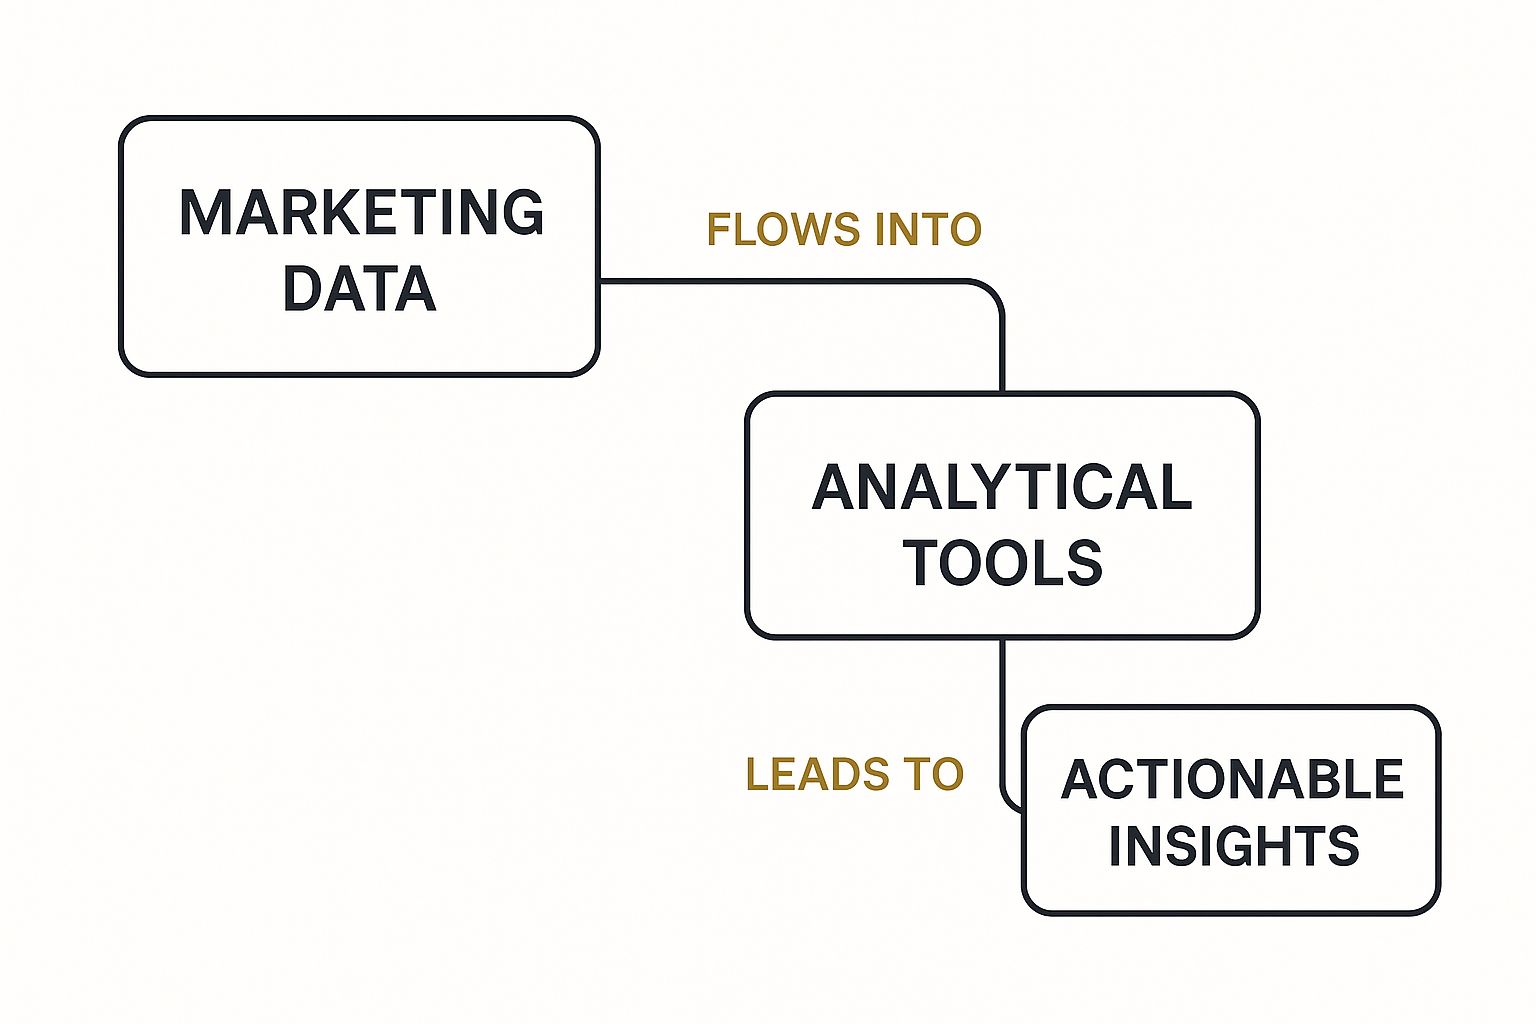
As the visualisation shows, it's a clear progression: marketing data gets collected, processed through analytical tools (which apply your chosen attribution model), and then turned into actionable insights that sharpen your strategy.
Single-Touch Attribution Models
The most basic models give 100% of the credit to just one touchpoint in the customer's journey. They're wonderfully simple to set up and understand, but they often paint a far too simple picture of reality.
First-Interaction Model
This model gives every bit of credit to the very first marketing channel a customer ever engaged with. It’s designed to answer one question: "What first brought this person to our brand?"
- Example: A user first finds your brand through a Facebook ad. They browse your site but don't buy anything. A week later, they see a Google Ad, click it, and finally make a purchase after you send them an email promotion. The First-Interaction model gives 100% of the credit to that initial Facebook ad.
- Best For: This is really for campaigns focused purely on top-of-funnel brand awareness. It helps you see which channels are doing the heavy lifting in introducing new people to your business.
Last-Interaction Model
On the flip side, the Last-Interaction model gives all the credit to the final touchpoint right before the conversion. It’s the marketing equivalent of giving all the glory to the goal-scorer.
- Example: Using that same scenario, the Last-Interaction model gives 100% of the credit to the email promotion the user clicked just before buying.
- Best For: It's a great fit for short sales cycles and campaigns built to drive immediate action, like flash sales. It tells you which channels are your best closers.
Key Insight: Single-touch models are like looking at a single frame of a film. They show you one moment in time but miss the entire plot of the customer's journey. While they have their uses for specific goals, relying on them as your only source of truth can lead to some really poor budget decisions.
Multi-Touch Attribution Models
This is where things get more sophisticated. Multi-touch models acknowledge that several touchpoints usually play a role in a conversion. They distribute the credit across multiple interactions, giving you a much more balanced and realistic view of what’s truly working.
Linear Model
This is the most straightforward of the multi-touch models. It simply splits the credit equally among every single touchpoint along the customer's path.
- Example: A customer sees a social media post, clicks a search ad a week later, and then converts from an email link. Each of the three touchpoints—social, search, and email—gets exactly 33.3% of the credit.
- Best For: This is ideal for businesses that want to value every interaction and maintain a consistent presence across all stages of the customer journey.
Time-Decay Model
This model also gives credit to multiple touchpoints, but it gives more weight to the interactions that happened closer to the moment of conversion. The first touchpoint gets the least credit, and the last gets the most.
- Example: In our three-touchpoint journey (social, search, email), the email would get the lion's share of the credit, the search ad would get less, and the initial social media post would get the least.
- Best For: It shines in scenarios with longer consideration cycles, like B2B sales or high-value purchases, where those final touchpoints are often the most persuasive.
Position-Based Model
Often called the "U-shaped" model, this framework gives 40% of the credit to the very first touchpoint and another 40% to the final touchpoint. The remaining 20% is then divided evenly among all the interactions that happened in the middle.
- Example: For a journey with four touchpoints, the first gets 40%, the last gets 40%, and the two middle touches each get 10% of the credit.
- Best For: It’s a favourite for marketers who believe the first touch (for discovery) and the last touch (for conversion) are the most important, but still want to give some value to the nurturing stages in between.
Measuring Performance Across Key Marketing Channels
Trying to measure marketing effectiveness with a one-size-fits-all approach is a recipe for confusion. Just as you wouldn’t use a hammer to turn a screw, you can’t apply the same set of metrics to every marketing channel. Each one has its own unique role, audience, and strengths, which means its performance has to be judged on its own terms.
To do this properly, you need to tailor your KPIs to the specific job each channel is designed to do. The numbers that signal a win for a punchy email campaign are worlds away from those that prove your long-term SEO strategy is building real authority. Let's break down how to track what truly matters across the most vital channels.
Gauging Your Social Media Impact
To understand your real impact on social media, you have to look past the vanity metrics. Likes and shares are nice, but they don't tell you much about your brand's standing or the health of your community.
For a clearer picture, it’s better to focus on more substantial metrics:
- Share of Voice (SOV): This is all about how much of the conversation in your industry is about you versus your competitors. It’s a fantastic indicator of your brand's visibility and relevance.
- Community Engagement Rate: Don't just count post likes. How many genuine comments, replies, and conversations does your content actually spark? This shows you’re building a real community, not just shouting into the void.
- Sentiment Analysis: Are people talking about your brand in a positive, negative, or neutral way? Tools that analyse sentiment give you a feel for how your audience perceives you, which is priceless for managing your brand’s reputation.
These metrics become even more critical when you bring influencer marketing into the mix. With the UK social media ad market projected to approach £9.95 billion by 2025, and influencer marketing making up £1.04 billion of that, the stakes are high. Brands rely on influencers for targeted engagement, but with 97% of UK adults worried about online harms, tracking sentiment is key to ensuring your partnerships build positive, responsible connections.
Uncovering True SEO Authority
SEO is a marathon, not a sprint. Its success can't be judged by daily traffic blips alone. Real SEO authority is something you build over months and years, and the right metrics will tell you if you're on the right path. The goal is to become a trusted, go-to resource in the eyes of both your audience and the search engines.
Keep your focus on these core indicators:
- Organic Traffic Growth: Forget daily spikes and look at your month-over-month and year-over-year trends for search engine traffic. Consistent, steady growth is the clearest sign your efforts are working.
- Keyword Rankings for High-Intent Terms: Don’t obsess over just any keyword. Track your position for phrases that show a user is ready to take action, like "best waterproof running jacket" instead of just "running jacket."
- Backlink Quality: A huge number of backlinks is far less important than their quality. A single link from a respected industry authority site is worth a hundred links from spammy directories.
Measuring SEO isn't just about seeing how many people land on your site. It's about figuring out if the right people are finding you and if search engines see you as a credible source of information.
Analysing Email Marketing Effectiveness
Email is still a powerhouse for direct communication and driving sales, but your open rate only scratches the surface. To really get what’s going on, you have to connect those initial clicks to what happens next.
While your Open Rate and Click-Through Rate (CTR) are essential starting points, your analysis has to go deeper. Track your Conversion Rate from email campaigns to see how many of those clicks actually turned into sales or leads. At the same time, keep an eye on your List Growth Rate and Unsubscribe Rate to check the health of your audience. A high unsubscribe rate after a campaign is a strong signal your message was off the mark. By digging into these numbers, you can fully appreciate the advantages of email marketing for driving real revenue.
Building Your Marketing Measurement Framework

Right, this is where it all comes together. You’ve got your metrics, your tools, and a handle on attribution. Now, it's time to build the system that connects them all. A marketing measurement framework isn't just a report you glance at once a month; it's a living, breathing system designed to turn messy data into a clear story about what’s actually working.
Think of it like building the cockpit for your marketing aeroplane. A pilot needs more than one gauge to fly safely – they need a full dashboard showing altitude, speed, fuel, and direction all at once. Your framework should give you that same comprehensive view, guiding everything from small campaign tweaks to major budget decisions.
The real goal here is to shift from just collecting data to creating a culture of continuous improvement. Your framework is the engine that powers this shift, making measuring marketing effectiveness a constant cycle of learning and refining, not just a one-off task.
Designing Your Reporting Dashboard
A truly great dashboard tells you a story in a single glance. It should answer your most important questions immediately, without making you hunt through endless spreadsheets. The trick is to arrange your KPIs logically, starting with the big-picture business goals and then letting you drill down into the nitty-gritty details of each channel.
You should build your dashboard around the goals we've already covered, like brand awareness, lead generation, and customer acquisition. For a dashboard that's actually useful, try structuring it like this:
- The Executive View: This is the 10,000-foot summary. It focuses on core business numbers like Customer Acquisition Cost (CAC), Customer Lifetime Value (CLV), and overall ROI.
- The Marketing Lead View: Here, you get a more detailed look at the marketing funnel. Think conversion rates at each stage, Cost per Lead (CPL), and MQL-to-SQL conversion.
- The Channel Specialist View: This is for the experts on the ground. It’s packed with granular metrics like organic traffic growth for the SEO team or post engagement rates for the social media manager.
This layered approach means everyone, from the CEO down to the marketing intern, gets the exact information they need for their role. The tools in The Digital Marketing Toolbox, especially those with customisable reporting features, are brilliant for creating these kinds of tailored dashboards.
Setting Benchmarks and Reviewing Results
A framework without context is just a collection of numbers. As soon as your dashboard is live, the next step is to set performance benchmarks. These are your realistic targets that tell you what "good" actually looks like for your specific business. The best place to start? Look at your own historical data to set an initial baseline.
Your measurement framework is not a final exam; it’s a living document. It’s the tool you use to ask smarter questions, run better experiments, and consistently prove marketing’s value to the business.
Finally, you need to get into a regular rhythm of reviewing your results. This simple habit creates accountability and makes sure that valuable insights are acted on quickly. A solid review cadence might look like this:
- Weekly Check-ins: A quick look at fast-moving metrics like campaign clicks and website traffic. This is for making small, tactical adjustments on the fly.
- Monthly Reviews: A deeper dive into trends. Here you’ll analyse conversion rates and lead quality to refine your overall strategy for the weeks ahead.
- Quarterly Strategy Sessions: This is the big one. You'll assess major KPIs like ROI and CLV to make significant decisions about budget allocation and plan for the next quarter.
By putting this kind of structured process in place, measurement stops being a passive, backward-looking task. Instead, it becomes an active, strategic engine for driving sustainable growth.
Frequently Asked Questions
Even with a solid plan, you're bound to run into questions as you start digging into your marketing effectiveness. This section is designed to tackle some of the most common ones I hear, offering straightforward advice to keep you moving forward.
How Often Should I Check My Marketing Metrics?
There's no single right answer here—it really depends on what you're measuring. For the fast-moving stuff like daily website visitors, ad clicks, or social media engagement, a weekly check-in is a good idea. This lets you spot trends as they happen and make quick, tactical tweaks.
But for the bigger-picture metrics, like your Customer Acquisition Cost (CAC) or overall conversion rates, you need to give them time to breathe. Looking at these monthly or even quarterly stops you from making knee-jerk reactions to normal, everyday fluctuations. The goal is to find a consistent rhythm for reporting that lines up with your business's natural cycles and planning schedule.
What’s the Biggest Mistake to Avoid When Measuring Marketing?
Without a doubt, the single biggest pitfall is getting obsessed with vanity metrics. These are the numbers that look great on paper but don't actually connect to what matters: your bottom line. Think social media followers, raw page views, or a spike in impressions. They can give you a nice ego boost, but they don't prove you're generating revenue.
You should always be asking one simple question: "So what?" How did that jump in website traffic translate into actual leads? Did that viral post have any real impact on sales? The most effective measurement is relentlessly focused on the numbers that directly link to growth, like lead quality, conversion rates, and return on investment.
Can a Small Business Really Measure Marketing on a Tight Budget?
Absolutely. Gaining clarity on your marketing performance has far more to do with discipline than with a huge budget. Many of the most powerful tools are completely free. Google Analytics, for example, offers an incredible wealth of data on your website's performance and how visitors behave. Likewise, nearly every social media and email marketing platform has its own built-in analytics dashboard that's surprisingly robust.
The secret isn't splashing out on expensive software; it's being smart and focused. Concentrate on a small handful of critical KPIs that genuinely tell the story of your business's health—things like conversion rate, cost per lead, and customer lifetime value. This approach delivers meaningful insights without the intimidating price tag.
Ready to build a smarter, more efficient marketing strategy? Discover the perfect tools for the job with The Digital Marketing Toolbox. Compare top-rated solutions for analytics, SEO, AI, and more to start driving measurable results today. Explore your options and find the right fit for your business.


