
Let's be honest, "marketing analytics" sounds a bit intimidating. But at its heart, it’s simply the process of using data to figure out what's working in your marketing—and what isn’t. It’s how you stop throwing money at campaigns and hoping for the best, and start making smart, strategic decisions that actually grow your business.
Think of it as trading guesswork for certainty.
Turning Data Into Your Strategic Compass

Imagine you’re the captain of a ship, trying to cross a vast ocean. Marketing without analytics is like setting sail with no map, no compass, and no idea where the currents are. You're moving, but are you getting closer to your destination? It's impossible to know.
Marketing analytics is your navigation system. It takes all the raw data your campaigns produce—website visits, social media likes, email opens, sales figures—and translates it into a clear map that guides your every move. It’s not just about counting clicks; it’s about understanding the why behind those numbers.
From Cost Centre to Revenue Driver
For years, marketing was often viewed as a "cost centre"—a necessary expense with fuzzy, hard-to-prove returns. Analytics completely flips that script. By drawing a straight line from your marketing activities to real business outcomes like leads, sales, and customer loyalty, you can show exactly how much value you're creating.
This is a game-changer. It’s how you justify bigger budgets, get a seat at the leadership table, and prove that marketing is a powerful engine for growth.
Marketing analytics transforms marketing from an art based on intuition into a science driven by evidence. It allows you to prove what’s working, fix what isn’t, and allocate your budget with confidence.
A data-first approach gives you solid answers to the most important questions:
- Which channels give you the best return on investment (ROI)? Is it your Instagram account, your email newsletter, or those Google Ads?
- What kind of content actually connects with your audience? Knowing this means you can create more of what people want to see.
- Where are you losing customers? You can pinpoint friction in the customer journey and smooth it out.
- How much does it really cost to acquire a new customer? This number, your Customer Acquisition Cost (CAC), is essential for profitable scaling.
The Growing Importance of Data-Driven Decisions
The marketing analytics market isn’t just growing; it’s exploding. This reflects a huge shift in how modern businesses operate. Companies that rely on data to understand customer behaviour and prove their results are the ones pulling ahead.
To dig a bit deeper, it helps to see how this fits into the bigger picture. Understanding the nuances between data analytics vs business intelligence can clarify its specific role, and our beginner's guide to digital marketing shows how analytics underpins every successful strategy.
In the end, it comes down to this: mastering analytics is no longer a "nice-to-have." It’s the key to staying competitive and relevant.
The Building Blocks of Marketing Analytics
To get your head around marketing analytics, you have to know what it’s made of. It’s a bit like baking a cake – you can’t just chuck random ingredients in a bowl and hope for a masterpiece. You need the right stuff – flour, sugar, eggs – in the right amounts. Marketing analytics is exactly the same, built on three essential pillars: key metrics, data sources, and analytical models.
Nailing these pillars is the difference between staring at a spreadsheet full of confusing numbers and having a clear roadmap for growth. Let's break down each one.
Key Metrics: The Numbers That Actually Matter
Here’s the thing: not all data is created equal. One of the first lessons in analytics is learning to tell the difference between metrics that make you feel good and metrics that actually move the business forward. This is the classic battle between "vanity" and "actionable" metrics.
Vanity Metrics are the flashy numbers like social media likes, page views, or total followers. They look impressive on a report and are great for a quick ego boost, but they don't tell you if you're making money or building a sustainable business. A post with 10,000 likes is nice, but if none of those people ever visit your website or buy a product, what was the real point?
Actionable Metrics, on the other hand, are tied directly to your business goals. These are the numbers that should guide your decisions and tell a real story about your performance.
- Conversion Rate: This is simply the percentage of people who take the action you want them to, like making a purchase or signing up for a newsletter. It tells you how effective your marketing message and website experience really are.
- Customer Acquisition Cost (CAC): How much does it cost you to win a new customer? That's your CAC. It's the total cost of your marketing and sales efforts divided by the number of new customers you brought in. A low CAC is a sign of efficient marketing.
- Customer Lifetime Value (CLV): This metric predicts the total revenue a single customer is likely to generate throughout their entire relationship with your brand. It's a powerful indicator of your business's long-term health.
- Return on Investment (ROI): This is the big one. ROI calculates the profit generated from your marketing campaigns compared to what you spent on them. It’s the ultimate measure of success.
By focusing on actionable metrics, you make sure you’re spending your time on activities that have a real, measurable impact on your bottom line.
Data Sources: Where Your Insights Come From
Your analytics ingredients – the raw data – come from all over the place. A good analyst knows how to gather and stitch together information from different sources to get a complete picture. Think of yourself as a detective gathering clues from various locations to solve the case.
Your data sources typically fall into a few key categories:
- First-Party Data: This is gold. It's the information you collect directly from your own audience. It includes website behaviour from tools like Google Analytics, customer information from your CRM (like HubSpot or Salesforce), and sales figures from your e-commerce platform. You own it, and it’s incredibly valuable.
- Second-Party Data: This is just someone else's first-party data that you get directly from them. For instance, a hotel chain might partner with an airline to share audience data for co-branded campaigns.
- Third-Party Data: This is data collected by companies that don't have a direct relationship with the consumer. It's often bundled together from lots of sources to provide broad demographic or behavioural insights, though its use is shrinking due to growing privacy concerns.
When you start integrating data from your website, social media, email marketing software, and ad accounts, you can finally connect the dots across the entire customer journey.
Analytical Models: Making Sense of It All
So you have your data and you know which metrics to track. Now what? You need a way to interpret it all, and that’s where analytical models come in. These are just frameworks and techniques that help you answer complex questions about your marketing performance. You don’t need to be a data scientist to grasp the basics.
Analytical models are like different lenses you can use to look at your data. One lens might show you which channel deserves credit for a sale, while another might help predict future trends.
A great analogy is a football team scoring a goal. Who really gets the credit? The striker who kicked the ball in? The midfielder who made the perfect pass? Or the defender who started the whole play? Analytical models help you figure this out for your marketing.
Two common types of models you'll encounter are:
- Attribution Modelling: This model tries to assign credit to the various touchpoints a customer interacts with before they convert. Was it the first ad they saw (first-touch), the last blog post they read (last-touch), or some combination of everything in between (multi-touch)?
- Marketing Mix Modelling (MMM): This takes a much broader, top-down view. It uses statistical analysis to figure out how different marketing inputs (like ad spend, promotions, and even external factors like seasonality) contribute to sales. It helps answer big-picture questions like, "How much should we invest in TV ads versus social media next quarter?"
By getting a handle on these three building blocks—metrics, sources, and models—you'll lay a solid foundation for a powerful and genuinely useful marketing analytics practice.
How to Build Your Marketing Analytics Framework
The idea of building a 'marketing analytics framework' can sound a bit intimidating, but it’s really just a structured way of thinking. Think of it like a recipe: without one, you're just throwing ingredients together and hoping for the best. With a framework, you have a step-by-step guide to turn raw data into decisions that actually grow your business.
Putting a solid structure in place ensures your efforts are focused, organised, and directly tied to what matters. Let’s walk through the four essential steps to building a framework that truly works. It all starts with the most important question: "Why are we even doing this?"
Start with Your Business Objectives
Before you get lost in a sea of clicks, impressions, and open rates, take a step back. What is the business actually trying to achieve? Analytics without a clear goal is just noise. Your business objectives are your north star, guiding every decision and making sure your marketing is pushing the company forward.
Forget vague goals like “boost brand awareness.” You need to get specific with measurable outcomes that directly impact the bottom line. These clear objectives are the bedrock of your entire framework.
Here are a few examples of what a strong business objective looks like:
- Increase online sales revenue by 20% in the next quarter.
- Generate 500 new marketing qualified leads (MQLs) per month.
- Reduce customer churn from 5% to 3% within six months.
- Improve customer lifetime value (CLV) by 15% by the end of the year.
Identify Your Key Performance Indicators
Once you know where you're going, you need road signs to make sure you're on the right track. Those signs are your Key Performance Indicators (KPIs). A good KPI is always tied directly to one of your business objectives, giving you a clear, measurable signal of your progress.
For instance, if your main objective is to increase online sales, your core KPIs might be conversion rate, average order value, and shopping cart abandonment rate. These metrics work together to tell a very specific story about how well you're meeting that goal.
A classic mistake is tracking absolutely everything. A powerful framework focuses on a handful of crucial KPIs that give a clean, uncluttered view of performance. It’s about cutting through the noise, not creating more of it.
This sharp focus means you spend less time pulling reports and more time acting on what the data is telling you. It also keeps the entire team aligned on what really moves the needle.
Integrate Your Critical Data Sources
Let's be honest: your marketing data is probably all over the place. You've got website activity in Google Analytics, lead information in your CRM, campaign stats in your email platform, and ad performance on social media. A proper framework pulls these disconnected threads together.
The aim here is to create a single, cohesive picture of the customer journey. You unlock incredible insights when you can trace a person's path from their first-ever website visit to their email interactions and eventual purchase. For example, understanding the true advantages of email marketing is one thing, but seeing its direct impact on sales figures from your e-commerce platform is another level entirely.
This integration breaks down the data silos that prevent you from seeing the full picture, allowing you to connect the dots between marketing spend and business results.
Choose Your Visualisation and Reporting Tools
The last piece of the puzzle is bringing your numbers to life. A spreadsheet full of raw data is useful for an analyst, but it’s not going to inspire action in a board meeting. This is where visualisation tools and dashboards come in. They turn complex data into simple charts and graphs that anyone can understand in a matter of seconds.
The right tool for you will depend on your budget, team, and how comfortable you are with the tech. You don't need a massively expensive system to get started. Just make sure your chosen solution can:
- Connect easily to your different data sources.
- Let you build custom dashboards that show your core KPIs.
- Automate your reporting to save time and keep things consistent.
A well-designed dashboard does more than just show numbers; it tells a story. It highlights trends, flags potential problems, and celebrates wins, making your analytics accessible and genuinely useful for everyone in the company.
Putting Marketing Analytics into Action
It’s one thing to talk about the theory of marketing analytics, but it’s another thing entirely to see it deliver real-world results. This is where the magic happens. Analytics isn't just about hoarding data; it's about asking the right questions and using the answers to make smarter, faster decisions. Think of it as the engine that turns raw information into a real competitive edge.
So, how does this actually work day-to-day? Let's move away from the abstract and look at a few examples of how different businesses use analytics to solve very real problems. These stories show how companies turn numbers on a dashboard into tangible growth, better efficiency, and stronger customer relationships.
Optimising Ad Spend for a Retail Brand
Imagine a growing online clothing shop. They're pouring thousands of pounds every month into ads on Facebook, Instagram, Google, and even TikTok. The big problem? They have a hunch that some ads are knockouts while others are just burning through cash, but they can't prove it. This is a classic case for analytics.
By pulling all their ad platform data into one place and connecting it to their sales figures, they can finally see the full picture. Instead of getting distracted by vanity metrics like clicks or likes, they focus on what really matters: Customer Acquisition Cost (CAC) and Return on Ad Spend (ROAS) for each channel.
Almost immediately, a few powerful truths jump out:
- Instagram Stories are the clear winner, bringing in £5 in sales for every £1 spent.
- Google Search Ads for specific product names have a super low CAC, attracting people who are ready to buy.
- The Facebook feed ads? They get plenty of clicks, but the CAC is so high they're barely breaking even.
Armed with this clarity, the retailer can act with confidence. They reallocate their budget, doubling down on Instagram and Google while pausing the weak Facebook campaigns to rethink the creative approach. Just like that, they've boosted their overall profit without spending a single extra pound on advertising.
Personalising the Journey for a Software Company
Now, let's look at a Software-as-a-Service (SaaS) company. Their challenge is different. They have a fantastic product with a free trial, but they’re seeing a huge drop-off in engagement after just a few days. Too many potential customers are signing up but never discovering the key features that would make them want to pay.
To fix this, the team turns to behavioural analytics. They start tracking how new users actually move through the software during the trial, looking for patterns that separate the people who convert from those who drift away. The data reveals something huge: users who create and share their first project within 48 hours are 70% more likely to subscribe.
This insight is a goldmine. The goal is no longer just to get sign-ups; it's to guide every new user towards that "aha!" moment as quickly as possible.
With this knowledge, they build a personalised onboarding email series. If someone hasn't created a project after 24 hours, they automatically get a friendly email with a quick video tutorial. This targeted nudge, driven entirely by data, dramatically increases feature adoption and lifts their trial-to-paid conversion rate by a massive 18%. It’s a perfect example of how an effective marketing strategy for small business uses analytics to prompt specific, high-impact actions.
Predicting Churn for a Subscription Service
Finally, think about a subscription box service. Their entire business lives and dies by customer retention. It costs far more to find a new customer than to keep an existing one, so keeping customer churn low is everything. The trouble is, they’re often caught by surprise when a happy, long-term subscriber suddenly cancels.
They decide to get ahead of the problem using predictive analytics. By analysing historical customer data, they build a model that can flag the subtle warning signs of a customer who is at risk of leaving. These signals could be anything from logging in less frequently, not opening weekly emails, or recently contacting customer support.
Now, the marketing team can be proactive, not reactive.
- The analytics system automatically flags at-risk customers.
- These customers are then placed into a targeted retention campaign.
- This might involve a special discount, a personal check-in from the support team, or a simple survey asking for feedback.
By catching these customers before they've made up their mind to leave, the company successfully lowers its monthly churn rate. This directly protects revenue and improves the lifetime value of their customer base. It’s a clear illustration of why so many organisations are turning to data to refine their marketing and fuel sustainable growth, a trend highlighted in market reports like this one on the UK data analytics market on imarcgroup.com.
Choosing the Right Marketing Analytics Tools
With a solid framework in mind, the next step is picking your tools. The market for marketing analytics software can feel like a crowded, noisy room. The trick is to think of it as building a toolkit, not searching for one single magic wand. Every tool has its own job, and the right mix comes down to your specific business goals, company size, and budget.
To choose wisely, it helps to group tools by what they actually do. Don't get distracted by brand names just yet; focus on the core function of each category. This way, you can build a tech stack that truly fits your needs, making sure you’re investing in tech that helps, not complicates, your strategy.
Web Analytics Platforms
This is ground zero. Think of a web analytics platform as the surveillance system for your website and digital properties. Its main job is to track and report on what your visitors do—how they found you, which pages they looked at, how long they stuck around, and where they bailed. This is where you get the raw data to understand your traffic and site performance.
What to look for:
- User Journey Tracking: The ability to trace the complete path a visitor takes through your site.
- Goal and Event Tracking: Simple ways to measure key actions, like someone filling out a form or watching a product video.
- Audience Segmentation: Features that let you slice and dice your audience by things like location, device, or behaviour.
For almost everyone, this category is the absolute starting point for any serious marketing analytics.
Customer Data Platforms
As your business grows, customer data gets messy. It's scattered across your website, your CRM, your email marketing tool, and maybe even your support desk. A Customer Data Platform (CDP) acts as a central hub, pulling all that information together to create a single, unified profile for every customer. It gives you that elusive 360-degree view of every single person's journey with your brand.
A CDP is essential if you want to get serious about personalisation. It lets you see the entire customer lifecycle, not just isolated clicks or opens. This unified view is what fuels genuinely effective, targeted marketing campaigns.
The diagram below shows how different businesses can use analytics to solve real-world problems—a process that is so often powered by the kind of unified data a CDP provides.
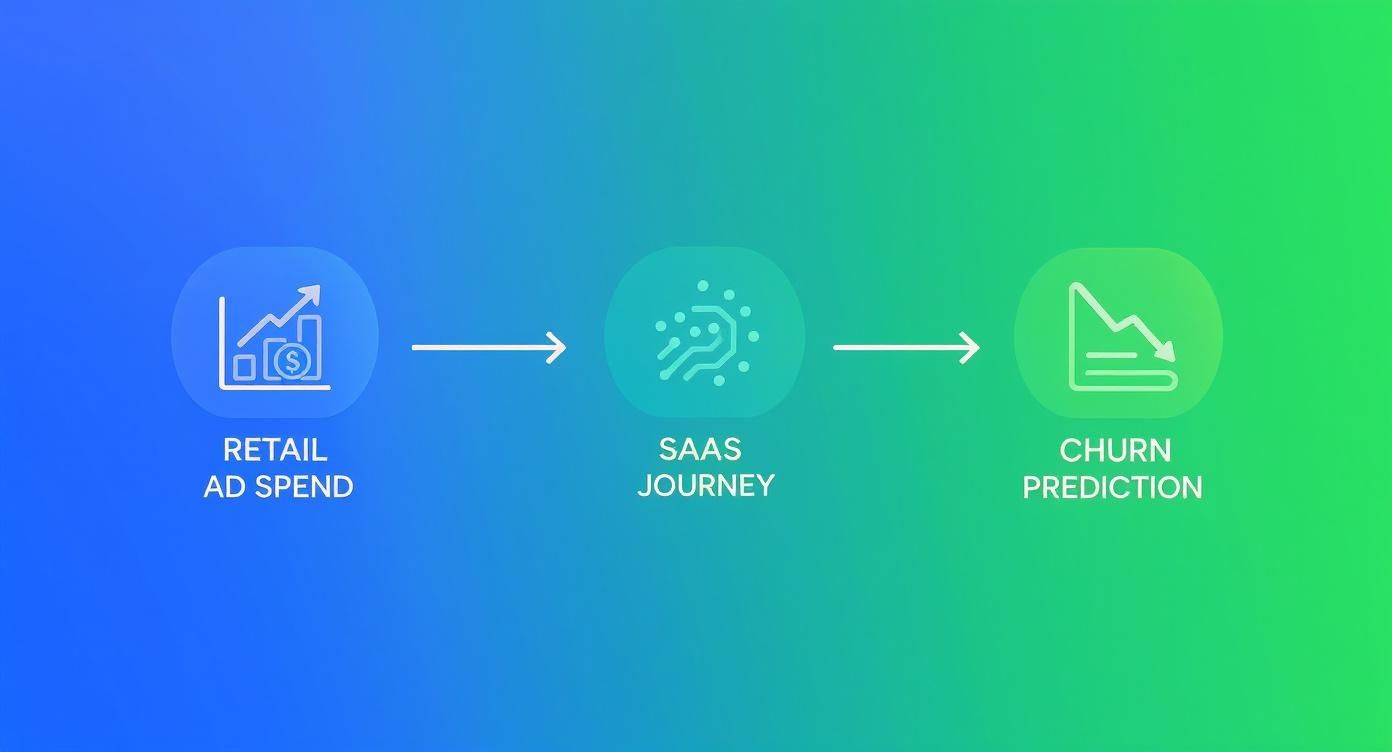
This workflow shows how analytics can be adapted, whether you're trying to optimise retail ad spend or predict which customers might cancel their subscription, highlighting the need for versatile data tools.
Business Intelligence Tools
Web analytics tells you what happened on your website. Business Intelligence (BI) tools help you figure out why it happened and what that means for the business as a whole. These platforms plug into multiple data sources—from your sales figures in the CRM to your ad spend on Google—and let you build custom dashboards to visualise the KPIs that really matter.
A BI tool is like the command centre for your data. It’s where you bring everything together to tell a cohesive story, moving beyond siloed reports to see the big picture of how marketing is actually impacting revenue.
Many of the best tools today are cloud-based, which has been a huge driver of their adoption. The cloud makes it more affordable and scalable for businesses of any size to manage massive datasets and apply advanced AI for deeper insights, all without a huge upfront investment. To get a sense of this shift, you can explore more about the UK data analytics market on marketresearchfuture.com.
Advanced AI and Predictive Solutions
This is the top tier of analytics tools, where the focus shifts from looking backwards to looking forwards. These platforms use machine learning and AI to crunch your historical data and predict what's likely to happen next. They can forecast sales, flag customers who are at risk of churning, or suggest the 'next best action' to take with a promising lead.
While they aren't for everyone just starting out, these tools can offer a serious competitive edge for businesses that are already mature in their data practices and want to become more proactive.
The Future of Marketing Analytics
https://www.youtube.com/embed/0sXYuIHPVik
The world of marketing analytics is moving at a breakneck pace. We’re no longer just looking in the rearview mirror to see what’s already happened; the real game-changer is using data to anticipate what’s around the corner and actively shape what comes next. A few powerful trends are fuelling this shift, setting the stage for a much smarter era of marketing.
The biggest driver here is undoubtedly Artificial Intelligence (AI) and Machine Learning (ML). These aren't just buzzwords. They’re automating incredibly complex analyses that used to take teams of data scientists days or even weeks to complete. Now, those powerful insights are becoming accessible to more marketers, moving the entire field from a reactive to a proactive mindset.
The Shift to Predictive and Prescriptive Insights
This leap in technology is pushing analytics past its traditional boundaries. For a long time, the job of analytics was mostly descriptive—it answered the question, “What happened?” While that’s still useful, the cutting edge has moved on to far more powerful applications.
-
Predictive Analytics: This is where we start answering, “What’s likely to happen next?” By digging into historical data, machine learning models can forecast future behaviour with impressive accuracy. Think of it as identifying which customers are showing signs of churning or flagging which new leads are most likely to buy.
-
Prescriptive Analytics: This is the most advanced stage, and it answers the ultimate question: “So, what should we do about it?” It takes prediction a step further by recommending concrete actions to get the results you want. For example, it might suggest the perfect discount to offer a specific group of shoppers to maximise their long-term value.
The entire field is pivoting towards forecasting customer behaviour and market trends. You can learn more about how predictive analytics in marketing is becoming a strategic cornerstone.
Navigating Data Privacy and Unified Platforms
Beyond AI, a couple of other major forces are reshaping how we approach marketing analytics. The first is the new reality of data privacy. With the slow death of third-party cookies, the focus has shifted entirely to first-party data—the information you collect directly from your audience. This means that building genuine trust and offering real value in exchange for that data is no longer optional.
The second major trend is the push for unified analytics platforms. Let’s be honest, businesses are fed up with having their data scattered across dozens of different tools. Your web analytics are in one place, your CRM data is in another, and your social media stats are somewhere else entirely. Modern platforms are finally tearing down those walls, stitching everything together to give you one clear, coherent view of the customer’s journey.
The future of marketing analytics isn't just about better data; it's about getting a complete, predictive, and actionable view of your customer, all while respecting their privacy.
By getting a handle on these trends now, you can position your marketing strategy to not just keep up with the changes, but to lead the way in this more intelligent, data-driven world.
Frequently Asked Questions
Even with the best guides, you're bound to run into a few head-scratchers when you start putting marketing analytics into practice. Let's tackle some of the most common questions that pop up on the journey to becoming a data-savvy marketer.
Marketing Analytics vs Web Analytics
It's easy to see why people mix these two up, but they really operate on different scales. The simplest way to think about it is that web analytics gives you a close-up picture of your website, while marketing analytics zooms out to show you the entire landscape.
-
Web Analytics is all about what happens on your own turf—your website or app. It answers questions like, "Which pages are most popular?" or "How long are people sticking around to read our blog posts?" It’s a deep dive into user behaviour in a specific environment.
-
Marketing Analytics is the big picture. It pulls together data from your website, CRM, social media channels, ad platforms, and even offline sales figures. The goal is to measure the total impact and return on investment (ROI) of all your marketing activities, not just what happens on your site.
So, web analytics is a vital ingredient in your marketing analytics recipe, but it’s just one part of a much bigger dish.
Starting Analytics on a Tight Budget
You absolutely don't need a massive budget to get started. The trick is to begin with the powerful tools that are already free and nail the basics before you even think about paying for anything.
For any small business, this is a fantastic starting line-up:
- Google Analytics: This one is non-negotiable. It’s completely free and offers an incredible amount of detail about your website traffic and audience. Set it up from day one.
- Built-in Social Media Analytics: Every platform—Facebook, Instagram, LinkedIn, you name it—has its own free analytics dashboard. Use them to keep an eye on your engagement and follower growth.
- Basic Spreadsheets: Don't underestimate a good old spreadsheet. Tools like Google Sheets are perfect for manually tracking crucial KPIs like sales, ad spend, and customer acquisition costs when you're just starting out.
What really matters isn't how much you spend on tools, but how consistently you measure. Start small, track what's essential, and you can build a more sophisticated setup as your business grows.
Overcoming the Biggest Challenges
Getting a solid analytics strategy off the ground isn't always smooth sailing. Most businesses stumble over the same three hurdles: messy data, a lack of skills, and getting the rest of the company on board.
First, poor data quality—often caused by inconsistent campaign naming or sloppy tracking—can make your insights totally unreliable. Then there's the skills gap; your team might have the data but not know how to interpret it or use the tools properly. Finally, without genuine buy-in from leadership, you'll struggle to get the time and resources needed to make data a real priority.
The way through this is to have a clear plan. Standardise how you collect data, invest in some training for your team, and—most importantly—prove the value to leadership by consistently connecting your analytics reports directly to business goals like revenue and growth.
Ready to build a smarter marketing toolkit? At The Digital Marketing Toolbox, we simplify the process of finding the right software to power your analytics and growth. Explore our curated catalogue of top-rated tools to find the perfect fit for your business. Discover your next essential marketing tool at https://grow-your-biz.com.


