

Data analytics in marketing is, at its heart, the practice of using real-world data to make your marketing better. Instead of just going with your gut, you're making decisions based on solid evidence about what your customers actually want and how your campaigns are really performing. It's the secret to unlocking smarter, more effective marketing that truly connects.
Why Data Analytics Is Your Marketing Superpower

Think about trying to navigate a new city without a map or your phone. You'd probably get there eventually, after a lot of wrong turns and frustration, but you'd waste a ton of time and miss all the best shortcuts. Marketing without data is exactly like that—you’re basically flying blind, just hoping you land in front of the right people.
Data analytics is your strategic guide. It's like having a skilled detective on your team, piecing together clues to crack the case. In this scenario, the clues are your data points—customer behaviour, campaign metrics, website traffic, social media engagement—and the case is figuring out what makes your audience tick.
From Guesswork to Guided Strategy
Before analytics became mainstream, marketing decisions often relied on intuition or what seemed to work last time. With data analytics for marketing, every move you make can be backed by concrete proof. This shift from guesswork to a guided strategy is precisely what separates good marketing from great marketing.
Taking an evidence-based approach brings some serious benefits to the table. It helps you:
- Deeply Understand the Customer Journey: You can follow the breadcrumbs to see how customers discover you, what content grabs their attention, and what ultimately persuades them to make a purchase.
- Prove Campaign Effectiveness: Move past superficial metrics. With data, you can show exactly how your marketing efforts contribute to crucial business goals like revenue and lead generation.
- Gain a Competitive Advantage: By analysing market trends and what people are saying, you can spot opportunities and react much faster and more accurately than your competitors.
Data analytics isn't just about crunching numbers. It's about asking the right questions. It turns raw data into a story that points you towards new opportunities for growth, optimisation, and innovation.
Connecting Data to Business Goals
Ultimately, every marketing activity should be driving business growth. Data analytics forges that critical link between your campaigns and the bottom line. Research on UK business priorities confirms just how central this connection has become.
A recent study revealed the top objectives that businesses are focusing their marketing analytics on. Here’s a quick breakdown:
Key Marketing Priorities Driven by Data Analytics
| Marketing Priority | Percentage of UK Businesses Focused on This Goal |
|---|---|
| Increasing sales revenue | 54% |
| Increasing brand awareness and customer engagement | 42% |
| Increasing leads for the sales team | 36% |
These figures show that data analytics isn't just a technical sideshow; it's the engine powering modern, results-driven marketing strategies across the UK. Objectives like increasing revenue, boosting engagement, and generating leads all depend on a strong analytical foundation to measure what's working and refine what isn't. You can learn more about these UK marketing priorities and see how businesses are putting data to work.
From Hindsight to Foresight: The Four Analytics Types
To really get the most out of data analytics for marketing, it’s important to realise that not all analysis is created equal. It's not a one-off task but a journey. You start by figuring out what’s already happened and move all the way to intelligently shaping what will happen next. This journey unfolds across four distinct types of analytics, each building on the one before it to create a seriously powerful framework for making decisions.
Think of it like a doctor treating a patient. First, they observe the symptoms. Next, they diagnose the cause. After that, they predict how the illness might progress and, finally, they prescribe a treatment plan. Marketing analytics follows that same logical path, moving from hindsight to foresight.
Descriptive Analytics: What Happened?
This is where it all begins—the most fundamental and common type of analytics. Descriptive analytics looks back at past data to tell you, in simple terms, exactly what happened. It gives you a clear, factual snapshot of performance but doesn't explain why it happened.
For marketers, this means looking at core metrics and reports to get a solid grip on past events. These insights are the bedrock upon which all other, more advanced, analytics are built.
- Example Scenario: You log into your analytics dashboard and see that your website traffic from social media dropped by 30% last month. That’s a descriptive insight; it tells you what occurred.
Diagnostic Analytics: Why Did It Happen?
Once you know what happened, the next logical question is why. Diagnostic analytics is all about digging deeper into your data to find the root causes behind that outcome. This is where you put on your detective hat, moving from simply observing to actively investigating, hunting for relationships and dependencies in your data.
This stage involves comparing different data sets, drilling down into the specifics, and spotting any anomalies that might explain the trend you’ve seen. It’s all about finding the source of the problem or the reason for a win.
- Example Scenario: To figure out that 30% drop in social traffic, you start digging. By looking into your referral data, you discover that a popular blog that used to send you a steady stream of visitors published its last post a month ago and has since gone quiet. That's the diagnosis; you now know why your traffic fell.
The infographic below shows how effective data analysis branches into key business outcomes like better targeting and improved ROI.
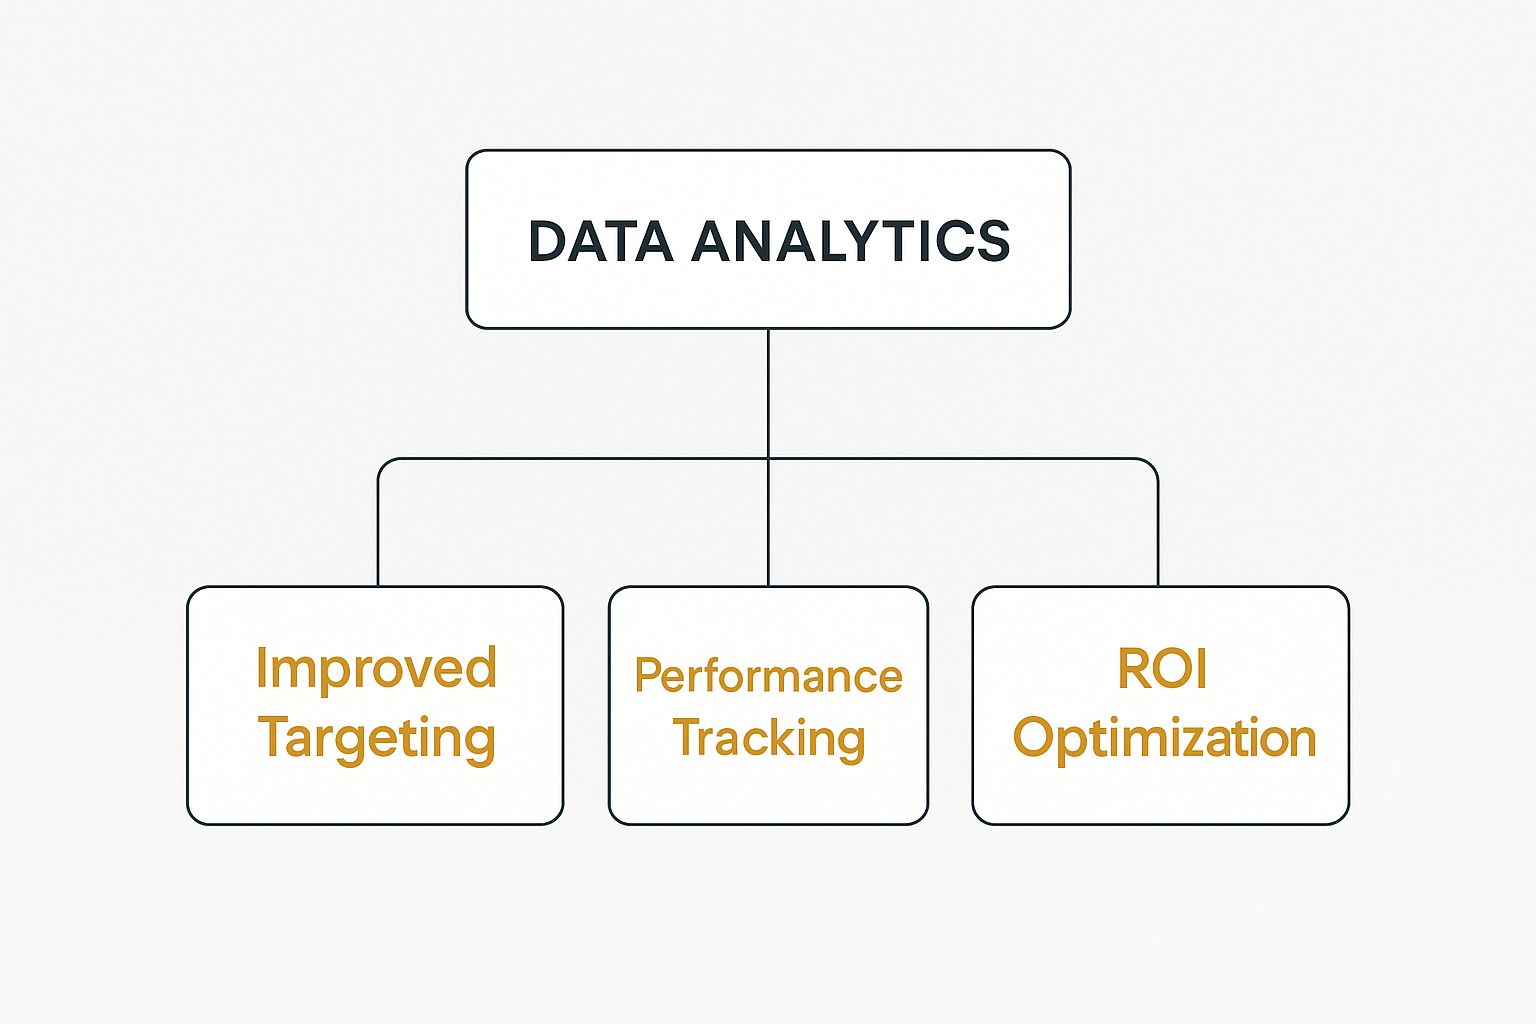
This hierarchy makes it clear that the ultimate goal of analysing data is to drive tangible results. It’s about moving beyond just tracking performance to actively optimising your marketing efforts for profit.
Predictive Analytics: What Will Happen Next?
With a solid understanding of past events and what caused them, you can start to look to the future. Predictive analytics uses your historical data, statistical models, and machine learning techniques to forecast what’s likely to happen next. It's about making educated guesses based on established patterns.
While it's not a crystal ball, predictive analytics gives you a data-driven forecast. According to McKinsey, companies that use customer analytics extensively report 115% higher ROI, largely because they can anticipate customer needs and market shifts.
This level of analysis helps you get ahead of trends, forecast sales, and spot potential risks or opportunities before they fully emerge.
- Example Scenario: Using your historical traffic data and factoring in the loss of that key referral source, your predictive model forecasts that your social media traffic will stagnate or even decline over the next quarter. This prediction is a clear warning of what will likely happen if you do nothing.
Prescriptive Analytics: What Should We Do?
This is the most advanced and valuable form of analytics. Prescriptive analytics goes a step beyond simply predicting an outcome; it actually recommends specific actions you can take to hit a goal or head off a future problem. It essentially provides a data-driven "prescription" for what to do next.
This type often relies on sophisticated AI and machine learning to simulate different scenarios and pinpoint the best course of action. It answers the final, most important question for any marketer.
- Example Scenario: Based on the predicted traffic slump, your prescriptive analytics model analyses potential solutions. It recommends that you proactively reach out to three other blogs in a similar niche to form new content partnerships, calculating that this has the highest probability of replacing the lost traffic and getting you back on track to hit your growth targets. You now have a clear, actionable plan: what you should do.
Your Blueprint for Actionable Marketing Insights
Knowing the different types of analytics is one thing, but how do you actually put them to work? Turning a mountain of raw information into smart, profitable decisions demands a clear process. Without a solid plan, it’s all too easy to drown in numbers without finding a single useful insight.
Let's walk through a practical, step-by-step blueprint for turning data into marketing gold. Think of it like cooking a gourmet meal. You need the best ingredients (data collection), a prepped and organised kitchen (data preparation), a tried-and-tested recipe (analysis), and beautiful presentation that makes people eager to dig in (storytelling). If you skip a step, the whole dish can fall flat.
Step 1: Data Collection
First things first, you need to gather your ingredients. Effective data analytics for marketing kicks off by pulling information from all the places your audience interacts with your brand. Simply put, you can’t analyse what you don’t measure, so casting a wide yet relevant net is absolutely essential.
Your key data sources will almost certainly include:
- Website Analytics: Tools like Google Analytics 4 are a goldmine of information on user behaviour, where your traffic comes from, and how people engage with your site.
- CRM Data: Your Customer Relationship Management system (think HubSpot or Salesforce) holds crucial details about your leads, customer interactions, and sales pipeline.
- Social Media Metrics: Every platform, from LinkedIn to Instagram, has its own analytics that reveal post performance, audience demographics, and engagement rates.
- Email Marketing Platforms: Services like Mailchimp provide vital metrics like open rates, click-through rates, and unsubscribes, giving you a clear picture of how your emails are landing.
The idea here is to collect data from every meaningful touchpoint your customer has with you.
Step 2: Data Preparation
Right, you've got your ingredients, but now they need to be washed, chopped, and organised. This is the data preparation stage, often called data cleaning. It might not be the most glamorous part of the job, but it’s arguably the most critical. After all, your analysis is only as reliable as the data you put into it.
Raw data is often messy, inconsistent, and full of gaps. The preparation stage, where you clean, standardise, and structure your data, can take up to 80% of an analyst's time but is absolutely essential for accurate results.
This stage involves a few key housekeeping tasks:
- Removing Duplicates: Making sure every customer, sale, or interaction is only counted once.
- Handling Missing Values: Deciding what to do with records that have empty fields—do you remove them, or can you fill in the gaps?
- Standardising Formats: Ensuring consistency across all your data sets. For example, making sure "UK," "U.K.," and "United Kingdom" are all treated as the same thing.
A clean, well-organised dataset is the bedrock of good analysis and stops you from drawing the wrong conclusions.
Step 3: Analysis
With your clean data prepped and ready, it's time to start cooking. This is where you apply the four types of analytics we've discussed to uncover patterns, spot trends, and answer your most pressing business questions. You'll shift from simply looking at what happened to strategically figuring out what to do next.
This is where you connect the dots. You might blend your website traffic data with sales figures from your CRM to pinpoint which marketing channels are actually driving revenue. Or perhaps you’ll dig into social media sentiment to understand why a recent campaign didn’t perform as well as you’d hoped. For a closer look at integrating these steps, a guide on building a marketing strategy for a small business can offer valuable context on how analytics should inform your overall plan.
Step 4: Storytelling and Visualisation
The final, crucial step is plating the dish. A brilliant analysis is completely useless if nobody understands it or knows what to do with it. Data storytelling is the art of translating complex findings into a clear, compelling narrative that your team can immediately grasp and act upon.
This is usually where reports and dashboards come in. Instead of just forwarding a spreadsheet packed with numbers, you use visuals to make the most important takeaways jump off the page.
- Dashboards: These give you a high-level, real-time view of your key performance indicators (KPIs), making them perfect for day-to-day monitoring.
- Reports: These offer a much deeper, more detailed look at a specific campaign or time period, explaining the "why" behind the numbers.
Great visualisation uses charts, graphs, and concise summaries to tell a story. A simple line chart showing a sales spike right after an email campaign is far more powerful than a raw table of data. By presenting your insights in a way that’s easy to digest, you empower everyone in your organisation to make smarter, data-backed decisions.
Putting Data Analytics to Work in the Real World
Understanding the theory behind data analytics for marketing is a great start, but seeing it in action is where its true power really shines. After all, theory doesn't drive revenue; results do. The most successful brands aren’t just gathering data for the sake of it—they're putting it to work, building smarter campaigns and forging much stronger customer connections.
So, let's move beyond the concepts and look at some concrete examples. By exploring how real strategies are applied, you’ll get a tangible framework for adapting these ideas to fuel your own business growth. Here are three high-impact strategies that show exactly how data moves from a spreadsheet to a serious competitive advantage.
Driving Repeat Business with Customer Segmentation
Imagine an e-commerce brand that sells outdoor gear. In the past, they might have sent the same generic "20% off" email to their entire customer list. The results were okay, but nothing special. By bringing in data analytics, they can now do something far more powerful.
They analyse purchase histories, browsing behaviour, and customer demographics to create distinct groups:
- The Weekend Hiker: Buys lightweight boots, daypacks, and water bottles.
- The Hardcore Mountaineer: Invests in technical ropes, ice axes, and high-altitude tents.
- The Family Camper: Purchases large tents, camping stoves, and kid-friendly gear.
Instead of a single, generic discount, they can now deliver highly relevant offers. The Weekend Hiker gets an alert about new trail maps, the Mountaineer sees a promotion on advanced climbing harnesses, and the Family Camper receives a "back to school" bundle for autumn trips. This targeted approach makes customers feel seen and understood, which dramatically boosts engagement and repeat purchases.
Doubling Lead Quality Through Campaign Optimisation
Now, let's think about a B2B software company running ads across Google and LinkedIn to generate demo requests. Initially, they split their budget evenly between the two platforms, hoping for the best. By using analytics to track the entire customer journey, they uncovered a game-changing insight.
While Google Ads brought in a higher volume of leads, the leads coming from LinkedIn were twice as likely to convert into paying customers. The cost per lead was higher on LinkedIn, but the ultimate return on investment was significantly better.
Armed with this data, the marketing team made a decisive, real-time adjustment. They shifted a significant portion of their ad spend from Google to LinkedIn, focusing on the channel that delivered higher-quality prospects. This single, data-driven decision doubled their qualified lead rate without increasing their overall marketing budget.
Social media platforms are central to the UK’s digital marketing scene, offering vast audiences and sophisticated analytics tools. As of early 2025, Facebook’s potential advertising reach in the United Kingdom was roughly 38.3 million users, having grown by about 1.2 million in the previous year. This huge user base allows for deep data analysis, enabling marketers to track engagement, optimise spending, and measure ROI with impressive accuracy, just like in our B2B example. You can explore more about the UK's digital environment on DataReportal.
Prioritising Efforts with Customer Lifetime Value
Finally, picture a subscription box service. Some customers sign up for one month and cancel, while others remain loyal for years. Using data analytics for marketing, the company can build a predictive model for Customer Lifetime Value (CLV).
This model looks at early customer behaviours—like their first product choice, how they engage with initial emails, and whether they used a discount code—to forecast their likely future value. The company soon discovered that customers who bought the "premium" box first had a 300% higher CLV than those who started with the basic option.
This insight completely changed their marketing priorities. They now focus their acquisition efforts on attracting these high-value customers, even if it costs a bit more upfront. They also use the model to spot customers at risk of cancelling, allowing them to proactively step in with special offers or support to keep their most valuable clients happy. By knowing which customers will be most profitable over time, they can invest their marketing resources far more intelligently.
Choosing Your Marketing Analytics Toolkit
Even the most brilliant strategy will fall flat without the right tools to bring it to life and measure its success. Once you've got a solid framework for analysis, your next job is to assemble your tech stack. It's easy to feel a bit swamped by the sheer number of options out there, but thankfully, they all boil down to a handful of key categories.
Thinking about it this way makes the whole process much simpler. Instead of getting bogged down in brand names and feature lists, you can focus on what you actually need the tool to do. This clarity is fundamental to building a strong foundation for your data analytics for marketing.
Core Tool Categories for Marketers
To get a complete picture of your performance, you'll likely need a tool from each of these main groups. Think of them as different pieces of a puzzle. Individually, they're useful, but when they work together, they give you a comprehensive view of your marketing's real-world impact.
- Web Analytics Platforms: These are your bread and butter for understanding what’s happening on your website. They track where visitors come from, what they look at, and what actions they take. Google Analytics 4 is the undisputed leader here, giving you incredible detail on user engagement and conversion paths.
- Customer Data Platforms (CDPs): A CDP, such as HubSpot, serves as your central hub for all customer information. It pulls data from your website, CRM, and other touchpoints to create one unified profile for each person, which is absolutely vital for effective personalisation.
- Social Media Analytics Tools: To see how your social media efforts are paying off, you need a dedicated tool like Sprout Social. These platforms track content performance, measure engagement, keep an eye on brand mentions, and help you understand your audience on every channel.
- Business Intelligence (BI) Tools: When you need to dig deeper or create custom dashboards, BI tools like Tableau are your best friend. They let you connect multiple data sources and build interactive reports that can reveal trends you might otherwise miss.
Your marketing toolkit shouldn't be a random collection of software; it's an interconnected system. The goal is to get data flowing seamlessly between platforms so you can trace a customer's journey from a social media ad right through to their final purchase.
Comparison of Marketing Analytics Tool Types
To help you visualise where each type fits, here’s a quick breakdown of the main tool categories and their primary functions. This can help you decide where to focus your attention and budget first.
| Tool Category | Primary Function | Example Tools |
|---|---|---|
| Web Analytics | Tracks website traffic, user behaviour, and conversions. | Google Analytics 4, Matomo |
| Customer Data Platform (CDP) | Unifies customer data from multiple sources into single profiles. | HubSpot, Segment |
| Social Media Analytics | Monitors social channel performance, engagement, and audience growth. | Sprout Social, Hootsuite |
| Business Intelligence (BI) | Visualises complex data sets from various sources for deep analysis. | Tableau, Microsoft Power BI |
Choosing the right mix of these tools will give you a clear, 360-degree view of your marketing activities and their results.
The Rise of AI in Marketing Analytics
Artificial intelligence isn't some far-off concept anymore; it's a real feature being built directly into the analytics tools we use every day. AI helps automate complex analysis, allowing marketers to unearth valuable insights much faster. This trend is especially picking up steam among small businesses here in the UK.
A survey in late 2024 revealed that over a third of UK small business operators plan to use AI in 2025 to generate marketing campaigns, with nearly 25% planning to use it to automate customer service. You can explore the full research on AI applications in UK digital advertising to see just how quickly things are changing.
This move toward AI-enhanced tools is making sophisticated data analysis far more accessible, even for smaller teams without dedicated data scientists.
Building Your Stack Strategically
You don't need to sign up for every tool on day one. A much smarter approach is to start with a solid foundation and expand your toolkit as your needs and confidence grow. For most businesses, the best starting point is mastering web analytics. It’s the key to understanding your most important digital asset: your website.
From there, you can layer in social media analytics and a basic CRM or CDP to get a more rounded view of your customers. This step-by-step method ensures you get real value from each platform without feeling overwhelmed. Our beginner's guide to digital marketing offers more ideas on where to focus as you get started. Ultimately, the best tools are the ones that directly support your business goals.
Common Questions About Marketing Data Analytics
Diving into marketing analytics can feel a bit like learning a new language. It’s totally normal to have questions as you start connecting data to your marketing strategy. Let's tackle some of the most common hurdles and queries marketers face, giving you clear, practical answers to get you moving.
Where Should a Small Business Start with Marketing Analytics?
If you're just starting out, don't try to boil the ocean. The best place to begin is almost always Google Analytics 4. It’s free, incredibly powerful, and gives you a fantastic window into who is visiting your website and what they do when they get there.
Start by getting comfortable with a few core metrics. Focus on understanding your user acquisition channels (how are people finding you?), engagement rates (what content keeps them interested?), and key conversion events (are they filling out forms or buying products?). Once you have a handle on that, you can layer in the built-in analytics from your social media accounts, like Facebook Insights. The key is to start small, build your confidence, and then expand.
What Skills Does a Great Marketing Analyst Need?
A truly great marketing analyst is a rare breed—part data scientist, part strategic storyteller. It’s not just about being able to crunch the numbers; it’s about knowing what questions to ask of them and how to translate the answers into a compelling story.
Key Analyst Competencies:
- Technical Know-How: Being fluent in tools like Google Analytics is table stakes. Real pros are also comfortable with data visualisation software like Tableau or Microsoft Power BI to bring the data to life.
- Analytical Mindset: This is the most critical skill. Anyone can see that traffic is down. A great analyst digs deeper to uncover why it’s down—perhaps a major referral partner changed their website, for instance.
- Clear Communication: They need to take complex data and present it as a clear, simple narrative that inspires the rest of the team and leadership to take action.
Ultimately, a top analyst doesn't just present reports. They uncover insights that directly shape business strategy and drive real growth.
How Do You Ensure High-Quality Data for Analysis?
The old saying "rubbish in, rubbish out" has never been more true than in data analytics. The insights you generate are only as trustworthy as the data you feed into your systems. Maintaining data quality is a constant process, not a one-and-done task.
A great first step is to create a simple data governance plan. This means getting everyone on the same page with standardised naming conventions for your campaigns (especially with UTM tracking), defining what each metric actually means for your business, and making someone responsible for data accuracy.
Schedule regular data audits to hunt down and correct any errors, duplicates, or missing information. While automation can help with the cleaning process, you can’t beat a manual spot-check. It’s also vital to train your whole team on why careful data entry matters, especially in connected platforms, as poor practices can have a ripple effect. This is particularly crucial for things like email list hygiene, as we cover in our guide on the advantages of email marketing.
At The Digital Marketing Toolbox, we take the guesswork out of finding the right tools to manage, analyse, and act on your data. Check out our hand-picked catalogue of top marketing and analytics solutions to build a tech stack that powers your growth at https://grow-your-biz.com.


