
In today's data-rich environment, simply collecting marketing metrics is not enough. The real power lies in transforming raw numbers into compelling narratives that guide strategy, justify budgets, and demonstrate return on investment. However, many marketers struggle to move beyond basic data dumps, creating reports that are either overwhelming or uninspired. This guide demystifies the process by showcasing eight crucial marketing report examples. We will dissect each one, revealing not just what to measure, but how to analyse the data to uncover actionable insights.
From high-level industry benchmarks in reports like HubSpot's State of Marketing to the granular detail of a social media campaign analysis, you will learn to build documents that command attention. We will explore everything from monthly Google Analytics performance to lead attribution and competitive analysis. The goal is to move past simple spreadsheets and create reports that drive intelligent business decisions. A robust reporting structure is a cornerstone of any effective marketing strategy, and this curated collection will provide the templates and strategic frameworks you need to turn your data from a liability into your most valuable asset.
1. HubSpot's State of Marketing Report
HubSpot’s annual State of Marketing Report is less a single document and more an industry-wide benchmark. It surveys thousands of marketing professionals globally to capture a snapshot of current strategies, challenges, and opportunities. This makes it one of the most powerful marketing report examples because it provides the data-backed context needed to evaluate your own team’s performance and strategy.
Instead of just tracking internal metrics, this report allows you to zoom out and see where the entire industry is heading. For instance, the 2023 report highlighted a massive 65% increase in social media advertising spend post-COVID and identified that 42% of marketers now use AI for content creation. These aren't just interesting statistics; they are directional signals for budget allocation and technology adoption.
Strategic Analysis and Application
The real value of this report lies in its application as a strategic planning tool. Marketing managers and agency leaders use its findings to justify budget requests, pivot channel strategies, and experiment with new tactics that have proven ROI industry-wide.
Strategic Insight: The primary function of the State of Marketing Report is to provide external validation and benchmarking. Use its data to compare your channel performance against industry averages, helping you identify over-performing areas to double down on and under-performing areas that may need re-evaluation or divestment.
The following infographic highlights some of the report's most actionable findings, particularly around technology adoption, content format performance, and advertising spend shifts.
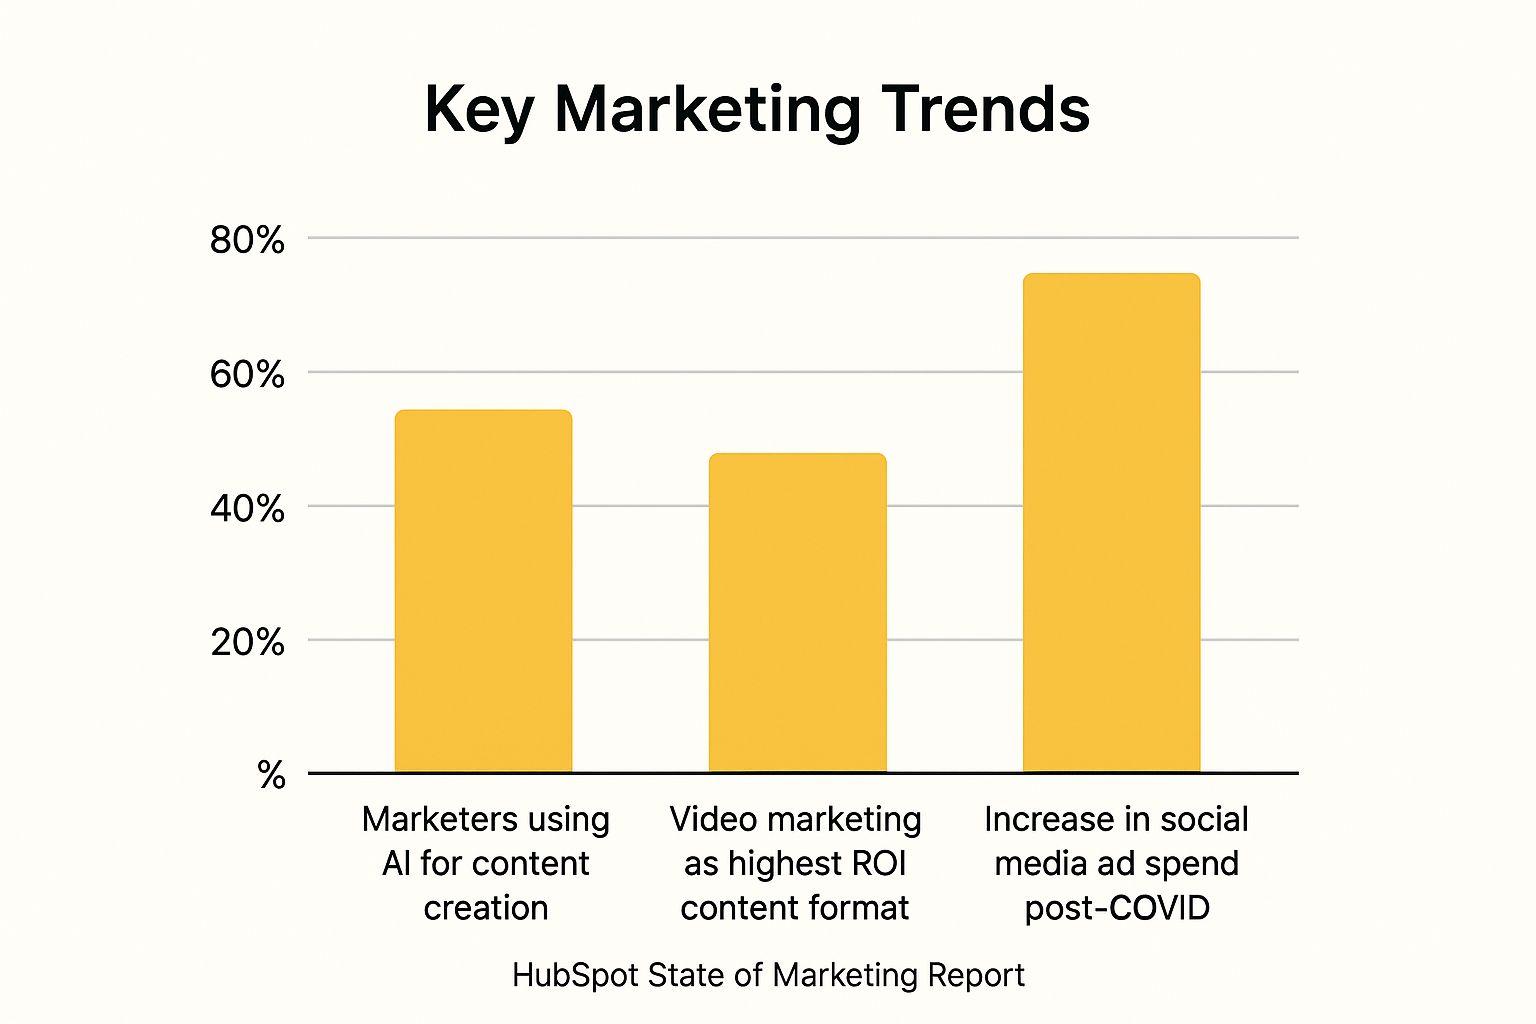
This data clearly illustrates the accelerating trends towards AI integration and the sustained dominance of video, providing a strong case for prioritising these areas in your marketing plan.
Actionable Takeaways
- Benchmark Your Budget: Compare your budget allocation with the report's findings. Are you under-investing in high-ROI channels like video marketing?
- Inform Your Content Strategy: With video confirmed as the top format for ROI, use this data to advocate for more video production resources.
- Validate Ad Spend: Reference the 65% increase in social media ad spend to justify your own budget increases or tests on platforms you haven't yet explored.
- Embrace AI: The report shows that nearly half of your peers are using AI. If you aren't, now is the time to start exploring AI tools for content ideation, creation, and data analysis.
2. Google Analytics Monthly Performance Report
The Google Analytics Monthly Performance Report is a foundational document for any business with a digital presence. It moves beyond high-level vanity metrics to provide a granular, data-driven analysis of website traffic, user behaviour, conversion rates, and channel performance. This makes it one of the most crucial marketing report examples for any organisation aiming to measure digital marketing ROI and optimise its online strategy.
Instead of guessing what works, this report provides concrete evidence. For instance, an e-commerce business can pinpoint which traffic source, such as organic search or a specific social media campaign, generates the most revenue. A B2B company can track its lead generation funnel, identifying drop-off points and optimising pages to improve conversions. These are not just numbers; they are direct insights into user actions and financial outcomes.
Strategic Analysis and Application
The true power of a Google Analytics report lies in its ability to inform tactical decisions and justify marketing spend. By consistently tracking metrics like bounce rate, session duration, and goal completions, marketers can identify what content resonates, which user paths lead to conversions, and where advertising budgets are best allocated.
Strategic Insight: The primary function of a Google Analytics report is to provide a performance baseline and diagnostic tool for your digital assets. Use its data to segment audiences, analyse user flow, and attribute conversions accurately. This transforms your website from a simple brochure into a powerful, measurable marketing engine.
The following dashboard example illustrates how key performance indicators (KPIs) like user acquisition, session sources, and conversions are visualised to provide a clear, at-a-glance performance overview.

This kind of visualisation helps stakeholders quickly understand which channels are driving value and where opportunities for improvement lie.
Actionable Takeaways
- Set Up Custom Goals: Before reporting, define and configure key conversion goals (e.g., form submissions, purchases, newsletter sign-ups) to measure what truly matters.
- Use UTM Parameters: Ensure all marketing campaigns use unique UTM codes. This allows you to track performance with precision, attributing traffic and conversions to the correct source.
- Focus on Actionable Metrics: Prioritise metrics that inform decisions, such as conversion rate by channel or user engagement on key landing pages, over vanity metrics like raw page views.
- Include Year-over-Year Data: Add context to your monthly figures by comparing them to the same period last year. This helps account for seasonality and reveals long-term performance trends.
3. Content Marketing Institute's B2B Content Marketing Report
The annual B2B Content Marketing Report from the Content Marketing Institute (CMI) is an essential resource for any business-to-business organisation. It delves deep into how B2B marketers create, distribute, and measure content, providing a specialised lens that other broader reports lack. This makes it one of the most vital marketing report examples for those in the B2B space, offering benchmarks specifically for their unique challenges.
Rather than just high-level trends, CMI’s research focuses on the practical realities of content marketing. For example, the 2023 report highlighted that while 73% of B2B marketers use content marketing, a significant portion cited a lack of time and resources as their primary obstacle. It also confirmed video as the format generating the highest engagement, giving teams concrete data to guide their production efforts.
Strategic Analysis and Application
The true power of this report is its ability to inform resource allocation and strategy within a B2B context. Marketing directors and content managers use its findings to build a business case for larger content teams, justify specific format investments like video or podcasts, and refine their measurement frameworks to align with industry best practices.
Strategic Insight: The primary function of CMI’s B2B report is to benchmark your content marketing maturity and operational efficiency. Use its data to compare your team’s challenges, tactics, and measurement sophistication against your direct peers, helping you identify critical gaps and opportunities for improvement.
The data presented acts as a roadmap for overcoming common hurdles and capitalising on proven tactics. It gives you the evidence needed to tell your leadership team not just what you want to do, but why it's the right move according to industry-wide data.
Actionable Takeaways
- Justify Resource Requests: Use the “lack of time” statistic as evidence when advocating for more headcount or freelance budget to scale your content operations.
- Prioritise High-Engagement Formats: With video confirmed as a top performer, use this report to justify shifting budget towards video creation and promotion.
- Refine Your Measurement: Compare your success metrics against those used by top-performing B2B companies in the report to ensure you’re tracking what truly matters.
- Address Common Challenges: Identify the top challenges cited in the report and proactively develop strategies to mitigate them within your own organisation before they become major roadblocks.
4. Social Media Campaign Performance Report
A Social Media Campaign Performance Report is a focused analysis that measures the effectiveness of your social media efforts across various platforms. Instead of a high-level monthly overview, this report zeroes in on a specific campaign's performance, tracking key metrics like engagement, reach, conversions, and return on investment (ROI). This makes it one of the most crucial marketing report examples for brands looking to understand which social channels, content formats, and messaging drive tangible business results.
For example, a fashion brand might use this report to track Instagram Story engagement rates for a new collection launch, while a B2B software company could measure the impact of a LinkedIn thought leadership campaign on lead generation. It moves beyond “vanity metrics” to connect social media activity directly to business objectives. This granular view is essential for optimising future campaigns and justifying social media spend.

Strategic Analysis and Application
The real power of this report is its ability to provide clear, data-backed answers about campaign success. Marketing managers use these insights to refine audience targeting, adjust content strategy mid-campaign, and reallocate budgets towards the highest-performing platforms and ad formats. It transforms social media from a brand awareness tool into a measurable revenue driver.
Strategic Insight: The primary function of a social media campaign report is to isolate variables and measure direct impact. Use it to compare the performance of different ad creatives, audience segments, or content types in a controlled environment. This allows you to build a playbook of what works for your specific audience, optimising for ROI rather than just reach.
By meticulously tracking conversions using UTM parameters, you can attribute specific sales or sign-ups directly back to a tweet, a Facebook ad, or an Instagram post. This level of attribution is a cornerstone of any effective digital marketing strategy. You can learn more about the fundamentals of digital marketing reporting on grow-your-biz.com.
Actionable Takeaways
- Define Campaign-Specific KPIs: Before launching, define what success looks like. Is it website clicks, video views, lead form submissions, or online sales? Tailor your report to these goals.
- Utilise UTM Tracking: Implement UTM codes on all social media links to accurately track how many users are converting from each specific post and platform.
- Analyse Content Performance: Identify which content formats (e.g., video, carousels, static images) generated the most engagement and conversions to inform future content creation.
- Conduct Competitor Benchmarking: Briefly analyse what competitors did during the same period. Did they run similar campaigns? How did their public engagement compare? This adds valuable context to your results.
5. Salesforce's State of Marketing Report
Similar to HubSpot's offering, Salesforce’s annual State of Marketing Report is a cornerstone piece of industry research, built on survey data from thousands of global marketing leaders. It excels at mapping the intersection of customer expectations, technological innovation, and business priorities. This makes it one of the most vital marketing report examples for leadership, as it directly connects marketing activities to customer-centric business outcomes.
Where this report stands out is its deep focus on the customer journey and real-time engagement. For instance, the latest edition revealed that a staggering 80% of customers now expect real-time interactions with brands. It also quantified the rapid acceleration of AI, showing adoption had increased by 52% year-over-year. This data provides a clear mandate for marketers to prioritise responsive, data-driven, and AI-enhanced customer experiences.
Strategic Analysis and Application
The true power of Salesforce’s report is its ability to arm marketers with the data needed to champion customer-centric initiatives. It provides a clear line of sight from emerging customer expectations to the technologies and strategies required to meet them. Marketing directors and CMOs frequently use these findings to build a business case for investment in data platforms, personalisation engines, and AI tools.
Strategic Insight: The primary function of the State of Marketing Report is to align marketing strategy with evolving customer expectations. Use its findings to benchmark your company's customer experience maturity and to identify the top priorities, like data integration, that will deliver the most significant impact on customer satisfaction and loyalty.
The report’s emphasis on high-performer data is particularly useful. It isolates the strategies used by the most successful marketing teams, offering a proven playbook for others to follow. For example, high performers are far more likely to have a unified view of customer data, a key insight that can direct internal technology and process improvements.
Actionable Takeaways
- Benchmark Your Tech Stack: Compare your current marketing technology against the adoption rates seen in the report. Is your team falling behind on critical tools for AI or data integration?
- Justify Customer-Centric Budgets: Use the statistic that 80% of customers expect real-time interactions to make a compelling case for investing in live chat, marketing automation, and other responsive technologies.
- Prioritise Data Unification: The report consistently highlights integrated customer data as a top priority. Use this to gain executive buy-in for projects related to a Customer Data Platform (CDP) or similar integration efforts.
- Leverage Regional Insights: The report offers regional data breakdowns. Focus on the data relevant to your specific markets to tailor your strategy and ensure it resonates with local customer expectations.
6. Email Marketing Campaign Report
An Email Marketing Campaign Report is a fundamental tool for any business leveraging email to connect with its audience. It moves beyond vanity metrics to provide a detailed analysis of campaign performance, tracking key indicators like open rates, click-through rates (CTR), conversion rates, and crucially, revenue attribution. This makes it one of the most direct marketing report examples for demonstrating a clear return on investment (ROI).
Whether it’s an e-commerce brand analysing an abandoned cart sequence or a SaaS company measuring the effectiveness of its onboarding emails, this report turns raw data into actionable intelligence. It provides the insights needed to refine messaging, improve segmentation, and optimise the entire email marketing funnel for maximum impact. Knowing the advantages of email marketing is one thing; proving them with data is another.
Strategic Analysis and Application
The true power of an email marketing report lies in its ability to drive iterative improvement. By consistently tracking performance, marketers can conduct A/B tests on subject lines, calls-to-action, and content formats to see what resonates most with their audience. It enables a shift from a “send and hope” approach to a data-driven strategy.
Strategic Insight: The primary function of an email report is to diagnose funnel performance and optimise for conversions. Use it to segment your audience and analyse how different groups behave. For example, comparing the CTR of new subscribers versus long-term loyal customers can reveal opportunities to create more personalised, effective campaigns for each segment.
This report is essential for justifying the continued investment in email as a channel. When you can directly attribute sales to a specific email campaign, it becomes much easier to secure budget and resources for your email marketing efforts.
Actionable Takeaways
- Look Beyond Open Rates: Focus on metrics that signal genuine engagement and intent, such as click-through and conversion rates.
- Segment Your Analysis: Break down your report by audience segment, campaign type, or even time of day to uncover hidden patterns.
- Monitor List Health: Always include metrics like bounce rates and unsubscribe rates. A shrinking or unhealthy list is a major red flag that needs addressing.
- Benchmark Your Performance: Compare your key metrics against industry averages to understand where you excel and where you need to improve.
- Connect to Revenue: Whenever possible, use tracking and attribution to tie email activities directly to sales and customer lifetime value (LTV).
7. Marketing Qualified Leads (MQL) Attribution Report
A Marketing Qualified Leads (MQL) Attribution Report connects marketing activities directly to lead generation, tracing the path a prospect takes from their first interaction to becoming an MQL. Popularised by platforms like HubSpot and Pardot, this analysis is crucial for B2B organisations as it reveals which channels, campaigns, and content are most effective at generating high-quality leads. This makes it one of the most vital marketing report examples for optimising the top and middle of the funnel.
Instead of just counting total leads, this report provides a granular view of their origins. For example, a B2B software company can see that while a blog post generates hundreds of newsletter sign-ups (leads), it's the downloadable white paper promoted via LinkedIn ads that produces the most demo requests (MQLs). This clarity allows marketers to shift resources from broad awareness campaigns to high-intent conversion activities.
Strategic Analysis and Application
The primary value of this report is its ability to directly link marketing spend to sales pipeline contribution. By understanding which touchpoints create qualified leads, marketing leaders can build a predictable, data-driven engine for growth. It moves the conversation with sales from lead volume to lead quality and revenue potential.
Strategic Insight: The core function of an MQL Attribution Report is to justify and optimise the marketing budget based on lead quality. Use it to identify and scale the channels that deliver leads who meet the agreed-upon qualification criteria, ensuring marketing efforts are directly aligned with sales objectives and improving conversion rates deeper in the funnel.
The report’s insights guide every aspect of demand generation, from content creation priorities to channel selection and campaign messaging.
Actionable Takeaways
- Align with Sales: Work with the sales team to establish a clear, universally agreed-upon definition of an MQL. This is the foundation for accurate reporting.
- Implement UTM Tracking: Use consistent UTM parameters across all digital campaigns to ensure every link click can be accurately attributed back to its source, medium, and campaign.
- Analyse Content Performance: Identify which content assets (e.g., webinars, case studies, white papers) consistently generate MQLs and prioritise creating more of what works.
- Optimise Channel Mix: If a channel like organic search generates a high volume of traffic but few MQLs, re-evaluate your keyword strategy to target higher-intent search terms. Conversely, double down on channels delivering high MQL-to-lead ratios.
8. Competitive Analysis Marketing Report
A Competitive Analysis Report is a strategic document that moves the focus from internal performance to the external market landscape. It dissects the strategies, positioning, and performance of your key competitors to uncover both opportunities and threats. This is one of the most vital marketing report examples for any business aiming to differentiate itself and capture more market share.
Instead of operating in a vacuum, this report provides the critical context of what others in your space are doing successfully (or unsuccessfully). For instance, a SaaS company might discover a competitor is gaining traction by focusing its messaging on a specific customer pain point you've overlooked. A retail brand could analyse a rival's social media and find that user-generated content campaigns are driving significantly higher engagement. These insights directly inform your own strategic decisions.
Strategic Analysis and Application
The primary value of this report is its ability to inform and refine your go-to-market strategy. It’s not just about copying what works; it's about identifying gaps in the market, anticipating competitor moves, and carving out a unique position for your brand. Leaders use these findings to adjust messaging, pivot channel focus, and develop more resilient campaigns.
Strategic Insight: Use a competitive analysis report to find your unique value proposition in a crowded market. By systematically evaluating competitors' strengths and weaknesses against your own, you can identify the “blue ocean” – the uncontested market space where you can thrive. This informs everything from product development to your core marketing message.
For a small business, understanding the competitive landscape is crucial for survival and growth. A well-researched report can form the foundation of an effective marketing strategy for a small business.
Actionable Takeaways
- Benchmark Your Messaging: Analyse the messaging and value propositions of 3-5 top competitors. Where are they strong? Where are they vague? Identify a unique angle your brand can own.
- Identify Channel Gaps: Use tools like SEMrush or Ahrefs to see which channels (e.g., organic search, paid ads, specific social platforms) your competitors dominate. Look for underserved channels where you can make an impact.
- Refine Your Content Strategy: Monitor competitor blogs, videos, and social posts. What topics generate the most engagement? What formats are they using? Use this to inspire and differentiate your own content calendar.
- Anticipate Market Shifts: Track competitor product launches, pricing changes, and major campaigns. This allows you to react proactively rather than being caught off guard.
Marketing Report Examples Comparison
| Report Title | Implementation Complexity 🔄 | Resource Requirements ⚡ | Expected Outcomes 📊 | Ideal Use Cases 💡 | Key Advantages ⭐ |
|---|---|---|---|---|---|
| HubSpot's State of Marketing Report | Moderate – Annual survey with data analysis | Medium – Large sample survey, data visualization | Industry benchmarking, trend insights | Marketing professionals seeking broad trend data | Comprehensive benchmarking, free access |
| Google Analytics Monthly Performance | High – Technical setup, data integration | Medium – Requires GA setup and dashboard customization | Real-time website and conversion performance tracking | Digital marketers optimizing online presence | Real-time data, comprehensive digital tracking |
| Content Marketing Institute B2B Report | Moderate – Annual survey focused on B2B | Medium – Survey and report creation | B2B content marketing strategy and performance insights | B2B marketers focusing on content strategy | B2B-specific, actionable content insights |
| Social Media Campaign Performance | Moderate – Multi-platform data collection | Medium – Use of native and third-party tools | Social engagement and conversion metrics | Marketers optimizing social media ROI | Cross-platform view, real-time insights |
| Salesforce's State of Marketing Report | High – Large global survey, complex data sets | High – Extensive global data and interactive reporting | Marketing tech adoption, customer experience insights | Enterprise marketers and executives | Largest sample size, global perspective |
| Email Marketing Campaign Report | Moderate – Dashboard setup with tracking | Low to Medium – Email platform metrics tracking | Email performance, segmentation, ROI analysis | Email marketers optimizing campaign effectiveness | Direct revenue attribution, high ROI |
| MQL Attribution Report | High – Multi-touch attribution modeling | High – CRM and marketing platform integrations | Accurate ROI, lead quality and channel effectiveness | Sales and marketing teams aligning lead generation efforts | Accurate ROI tracking, multi-channel attribution |
| Competitive Analysis Marketing Report | High – Extensive competitor data research | Medium to High – Tools and manual research | Strategic market positioning and competitive insights | Strategic planners analyzing competitors | Market gap identification, competitor benchmarking |
From Insight to Impact: Putting Your Reports to Work
We have journeyed through a comprehensive collection of marketing report examples, from high-level strategic summaries like HubSpot's State of Marketing Report to granular, channel-specific analyses like an Email Marketing Campaign Report. Each template and real-world case study serves as more than just a blueprint; they are a testament to the power of data-driven decision-making. The true value isn't found in simply knowing what to measure, but in understanding why you are measuring it and what actions to take next.
The common thread weaving through all these examples, from the Content Marketing Institute's industry benchmarks to a detailed MQL Attribution Report, is the transformation of raw data into strategic intelligence. Effective reporting closes the loop between investment and return, proving marketing's value and justifying future budgets. It moves your team from a state of reactive “what happened?” to a proactive “what's next?”.
Your Action Plan for Better Reporting
Mastering these marketing report examples is the crucial first step towards building a truly data-informed marketing function. The ultimate goal is to move from static reporting to a dynamic strategic process, where insights from one report directly influence the actions and outcomes measured in the next.
Here are your actionable next steps:
- Establish a Rhythm: Don't let reporting be an afterthought. Schedule regular reporting cycles, whether weekly, monthly, or quarterly, depending on the report type. Consistency is key to identifying trends and anomalies.
- Contextualise Everything: Numbers without context are meaningless. Always compare your results to previous periods, established benchmarks, or specific campaign goals. As seen in the competitive analysis example, context from outside your organisation is equally vital.
- Tell a Story: The best reports guide the reader through a narrative. Start with the most important takeaway (the headline), provide supporting evidence (the data), and conclude with a clear recommendation (the next step).
- Automate Data Collection: Free up your time for analysis by automating the data gathering process. Use dashboards and integrations to pull metrics from platforms like Google Analytics and your social media channels automatically, so you can focus on strategy, not spreadsheets.
Remember that the most effective reports are not static documents but living tools that evolve with your strategy and the market. By embedding these reporting practices into your daily workflow, you create a powerful feedback loop for continuous improvement and sustainable growth. The journey from scattered data points to a cohesive marketing strategy is powered by your commitment to consistent, insightful, and actionable reporting. The marketing report examples we've explored provide the map; it's now up to you to navigate the path to success.
Ready to build powerful, data-driven reports without the manual effort? The Digital Marketing Toolbox centralises all your analytics, SEO, and social media tools into one seamless platform, making it easier than ever to gather insights and create compelling reports. Start your free trial today and turn your data into your most valuable asset. The Digital Marketing Toolbox


