

If you've ever stared at your Google Analytics reports, puzzled by the "(not provided)" keyword, you're certainly not alone. It's not a glitch or a setting you've missed. It’s the result of a deliberate change Google made years ago to protect user privacy, and it completely reshaped how we analyse organic search performance.
Why Your Organic Keywords Disappeared From Analytics
Back in the day, marketers could see the exact organic keywords people typed into Google to find their website. This was a goldmine for understanding user intent and measuring content ROI. But that all changed.
The Big Switch to Secure Search
The story really kicks off in 2011, when Google started encrypting search data for anyone logged into a Google account. The real game-changer, however, landed in 2013 when they decided to encrypt all organic searches by default. They did this by moving everyone over to secure HTTPS search.
This is a visual representation of how a secure connection, indicated by HTTPS, is established.

That little "S" in HTTPS stands for "Secure," and it means the conversation between a user's browser and a website's server is encrypted. While this is a huge win for privacy, it's also the very thing that strips the keyword data from the information passed along to Google Analytics.
The impact was swift and significant. For many UK websites, this meant that by 2020, over 97% of organic search keywords were hidden behind the "(not provided)" label. Suddenly, a critical data point was gone.
This single move created one of the biggest blind spots in modern SEO. We went from having precise keyword-level data to having to piece together a much bigger puzzle. Marketers who relied on that data were suddenly forced to find new ways to measure performance.
It's a common point of confusion: why can I see keyword data for my paid Google Ads campaigns, but not for my organic traffic? The answer lies in how the data is handled. For paid ads, you're a paying customer, and Google provides that performance data as part of the service. For organic search, the priority is user privacy.
Here’s a simple breakdown of the key differences:
How Keyword Data Differs in Organic vs Paid Search
| Data Point | Organic Search (Google) | Paid Search (Google Ads) |
|---|---|---|
| Keyword Visibility | Mostly hidden ("not provided") | Fully visible in Ads reports |
| Primary Reason | User privacy (HTTPS encryption) | Performance reporting for advertisers |
| Data Source | Google Analytics (referral data) | Google Ads platform (auction data) |
| Your Control | None | Full control over bidding and tracking |
This distinction is crucial. The data isn't missing because of an error; it's intentionally partitioned to serve two different purposes: protecting searcher privacy and providing advertiser transparency.
Adapting to the New Reality
Understanding this history is the first step. The solutions we'll cover aren't about "fixing" the "(not provided)" issue, because it can't be fixed. Instead, it's about adapting your strategy to this privacy-focused world.
The focus has shifted from obsessing over individual keywords to looking at the bigger picture. We now analyse things like landing page performance, user behaviour, and broader content topics. The question is no longer, "Which keyword brought this person here?" but rather, "Is this page successfully answering the questions our organic visitors likely have?"
To learn more about the broader strategies involved, it’s worth exploring the wider field of Marketing Analytics. If you're just getting started, our https://grow-your-biz.com/beginners-guide-to-digital-marketing/ offers the foundational knowledge you need. The modern approach requires a smarter, more holistic view, combining data from different sources to truly understand your organic success. The following sections will walk you through exactly how to do that.
Using Google Search Console to Reclaim Keyword Data
While Google Analytics has left a gaping hole where organic keyword data used to be, Google thankfully provides another free tool that pulls back the curtain: Google Search Console (GSC). Think of GSC as your direct line to Google’s search index. It's the place you go to see how your site is really performing in search results, complete with the actual queries people are typing to find you.
The day everything changed for UK digital marketers was September 23, 2013. That's when Google shifted all searches to HTTPS, effectively cutting off the flow of organic keyword data into Google Analytics. This privacy-focused move meant that, over time, 100% of Google organic keywords ended up hidden behind the dreaded “(not provided)” label. This fundamentally altered how we measure SEO performance. You can read more about this pivotal shift on Genetic Digital.
This change essentially created a blind spot in our traffic data, forcing us all to adapt our SEO strategies.
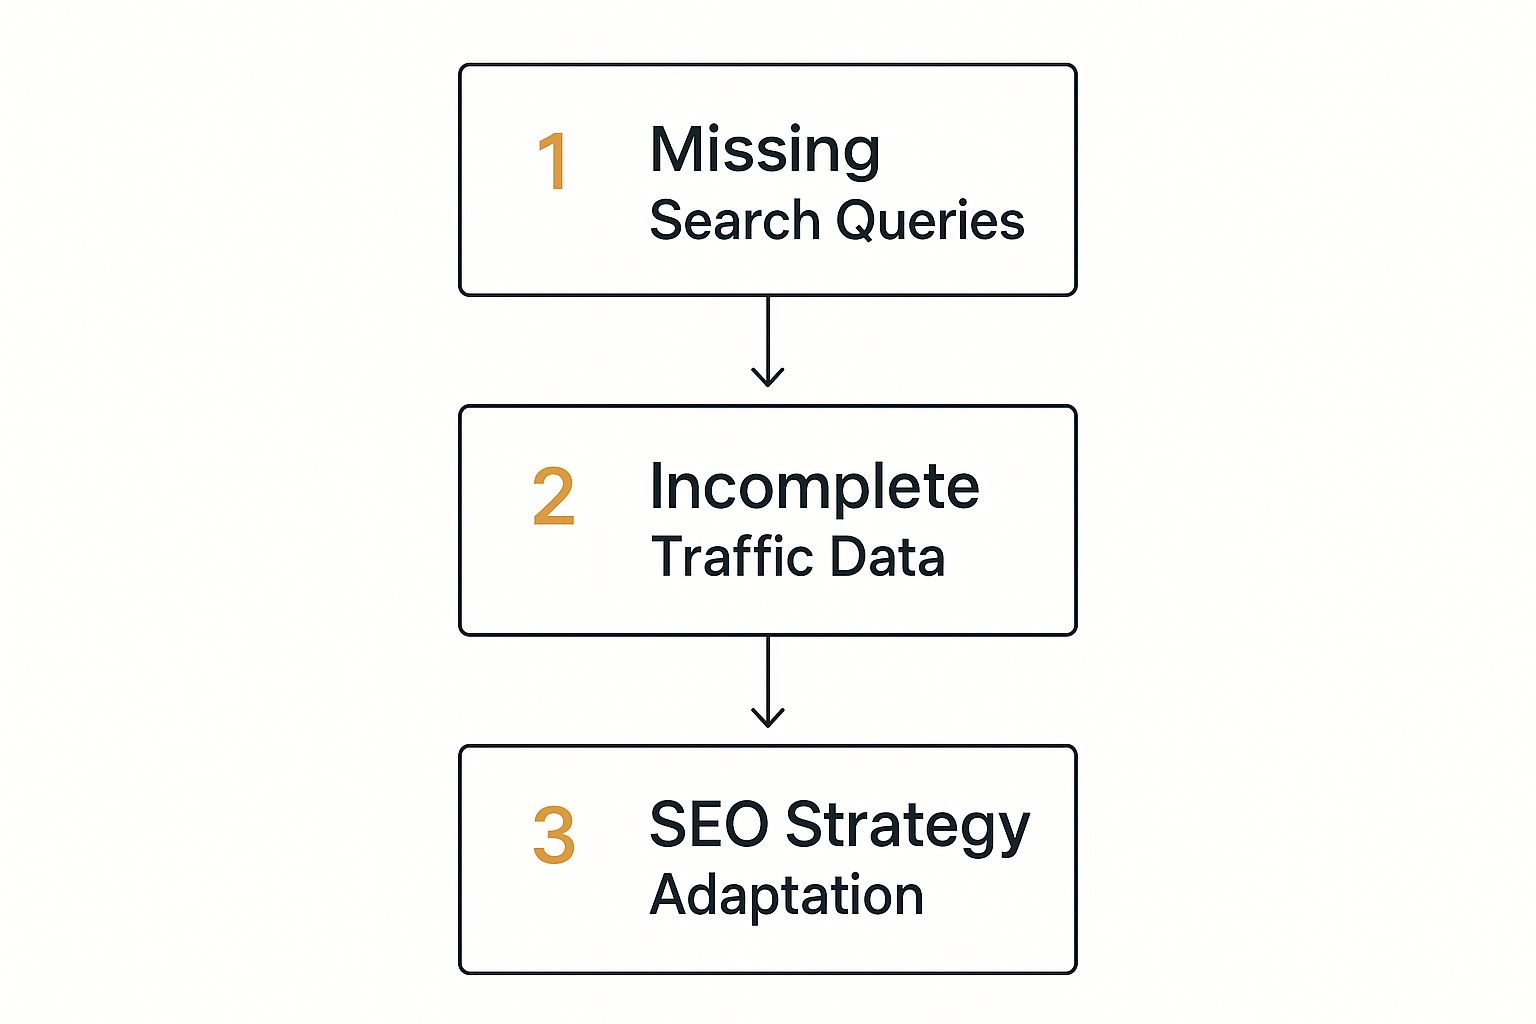
As the visual shows, without direct keyword insights, we have to find new ways to interpret performance and guide our optimisation efforts.
Unlocking Insights with the Performance Report
The heart of GSC, and your new best friend for keyword analysis, is the Performance report. This is where you’ll find the goldmine of data that Analytics no longer shares. Instead of just seeing anonymous traffic numbers, you get a detailed breakdown of the real-world search terms, or "queries," that lead to people seeing and clicking on your website.
This dashboard is your gateway to understanding not just the traffic, but the search behaviour that drives it. Unlike Analytics, GSC is all about pre-click data, giving you four crucial metrics for every single query:
- Clicks: How many times someone actually clicked your site's link from the search results.
- Impressions: The number of times your site appeared in search results for that query.
- Average CTR (Click-Through Rate): The percentage of impressions that turned into a click.
- Average Position: Your site’s average ranking in the search results for that query.
A pro tip is to connect your GSC property directly to Google Analytics. This lets you pull this valuable query data straight into your Analytics reports, creating a much more unified view where you can see which search terms are driving traffic to specific landing pages.
Finding Actionable Opportunities in Your Data
Just looking at the data is one thing; the real magic happens when you turn those numbers into a concrete strategy. One of the most powerful tactics I use is hunting for "striking distance" keywords. These are the terms where you’re already ranking on the second or third page of Google (think an average position between 11 and 30).
These keywords are your low-hanging fruit. Google already sees your site as relevant for these terms, but you just don't have enough authority to break onto that all-important first page. A bit of focused optimisation—like improving your on-page SEO, adding more internal links, or simply refreshing the content—is often all it takes to give them the push they need. The result? A significant jump in traffic.
Let's imagine you run an e-commerce site selling handmade leather bags in the UK. Digging into your GSC Performance report, you might find something like this:
- Query: "sustainable leather weekend bag uk"
- Clicks: 15
- Impressions: 2,500
- CTR: 0.6%
- Average Position: 14.2
This data tells a compelling story. People are actively searching for your exact product, but because you're lingering on page two, almost no one is seeing your link, let alone clicking it. This is a perfect candidate for optimisation. By improving that page’s content to really hammer home the "sustainable" and "UK" aspects of the query, you could easily climb in the rankings and start capturing a much bigger slice of those 2,500 impressions.
Suddenly, the frustration of the "(not provided)" problem transforms into a proactive, data-driven SEO plan. You’re no longer guessing what people are searching for; you're using concrete data straight from Google to find and act on your biggest growth opportunities.
How to Infer Keywords from Landing Page Performance
With the exact organic keyword hidden away, your top-performing landing pages become your best clues. It’s time to put on your detective hat. Instead of getting hung up on the specific search terms, we can shift our focus to the performance of the pages that are actually pulling in that organic traffic.
The logic here is pretty simple. Let's say you have a page dedicated to "eco-friendly waterproof hiking boots for women," and it's bringing in thousands of organic visits every month. You don't need to see the exact search query to know, with a high degree of confidence, that people are finding it by searching for something very close to that topic. The page itself tells the story.
Linking Pages to Keyword Themes
The first practical thing to do is to map your key landing pages to their main keyword themes. This doesn't mean creating a monstrous spreadsheet for every single URL on your site. Just focus on your most important organic entry points—the pages doing the heavy lifting.
To get started, head over to the Landing Pages report in Google Analytics (you'll find it under Reports > Engagement > Landing Page). The key here is to filter this report to show only your organic traffic. This immediately gives you a prioritised list of the pages already winning in search.
Now, for each of your top 10-20 pages, identify the core topic it’s built around.
- Primary Keyword Theme: This is the page's main subject. For a product page, it might be "men's merino wool base layer."
- Secondary Keyword Themes: Think of these as the related subtopics or long-tail ideas the page also covers, like "best base layers for cold weather" or "merino wool thermals UK."
Doing this creates a powerful framework. You're essentially turning your landing page report into a proxy for a keyword performance report, giving you a clear picture of what each page is supposed to be ranking for.
This isn't just a workaround for the 'not provided' problem. It's about aligning your SEO strategy with how modern search engines actually think—focusing on topical authority and user intent rather than just stuffing keywords.
Analysing Performance Metrics for Intent
Once you’ve mapped your pages to their keyword themes, you can dig into the GA metrics to see how well they're actually performing for those topics. Don't just glance at the session counts; the real insights are in the engagement signals.
Look for pages that have:
- A High Engagement Rate: This is a great sign that visitors are finding what they expected and are interacting with your content. A low engagement rate, on the other hand, might signal a mismatch between what you think the page is for and what users are actually looking for.
- Strong Conversion Numbers: If a page about "business liability insurance quotes" is generating a ton of goal completions for your quote form, you can be confident it's attracting qualified traffic with serious commercial intent.
- Low Bounce Rates (in Universal Analytics): While it’s less of a focus in GA4, a low bounce rate on a key landing page has always been a classic indicator that the content immediately satisfies the visitor's needs.
Here's a real-world scenario. Imagine you have two blog posts, both getting similar amounts of organic traffic. One is a guide titled "How to Choose a Tent," and the other is a specific review of the "North Ridge Everest 3-person tent."
When you check the data, you find the review page has a 7% higher engagement rate and drives twice as many affiliate clicks. That’s a massive insight. It tells you that while both topics are popular, the traffic landing on your specific review page is far more valuable. You can infer that long-tail keywords with buying intent are driving this performance, which is a clear signal to create more content targeting specific product reviews.
This is exactly how landing page analysis helps you make smarter strategic decisions, even without seeing every last google analytics not provided keyword.
Advanced Methods for Deeper Keyword Insights
While Google Search Console and landing page analysis are your bread and butter for figuring out organic traffic, sometimes you need to go a level deeper. If you really want to understand your audience and see how your SEO is paying off, a few advanced tactics can give you that extra clarity.
One of the most powerful moves you can make is to split your branded traffic from your non-branded traffic right inside Google Analytics. This simple separation tells you a story about how completely new customers find you versus how people who already know you come back.
Separating Brand and Non-Brand Traffic
So, what’s the difference? Brand traffic is anyone searching for you by name (e.g., "The Digital Marketing Toolbox reviews"). They already know who you are. Non-brand traffic is the goldmine – people searching for a solution or product without a company in mind (e.g., "best email marketing tools"). They're the new audience you want to capture.
By setting up a custom filter in Google Analytics to isolate traffic that doesn't include your brand name, you can finally see how well your content is doing its job of attracting strangers. This filtered view gets right to the heart of your content strategy, helping you answer some critical questions:
- Which blog posts are actually bringing in new, top-of-funnel visitors?
- Are these non-brand visitors sticking around and moving towards a conversion?
- Is our growth coming from people who already know us, or are we genuinely being discovered?
This isn’t just about looking at traffic numbers; it’s about strategic audience analysis. It’s an essential step for any business that’s serious about measuring the true ROI of its content marketing. Understanding how to nurture these new visitors is the next step, and the advantages of email marketing show just how powerful that can be.
Think of it this way: Separating brand from non-brand traffic is like having two separate conversations. One tells you how strong your reputation is, while the other reveals how effective your SEO is at capturing new demand. You need both for healthy, sustainable growth.
Exploring Third-Party Keyword Recovery Tools
The frustration around (not provided) keywords has, unsurprisingly, created a whole market of third-party tools promising to bring them back. Platforms like Keyword Hero aim to "un-provide" your keywords by cleverly stitching together data from different places.
How do they work? Typically, they combine your Google Analytics session data, your Google Search Console query data, and their own machine learning algorithms. The goal is to make an educated guess, matching an individual user session in Analytics with a probable search query from Search Console. The end result is a report right inside your Analytics account that fills in the keyword data for a good chunk of your organic visits.
Across the UK, digital marketers have turned to these solutions to get back some of the insights we lost. While GSC gives you the big picture, these tools try to connect the dots back to specific user behaviour. Just be aware they usually need linked Google accounts to function and tend to struggle with sites that have fewer than 100 daily sessions.
Evaluating the Pros and Cons
The idea of reclaiming all that lost keyword data is incredibly tempting, but it's important to keep your expectations in check. These tools are clever, not magic.
Potential Benefits
- Granular Insights: They can link specific keywords to on-site behaviour, like engagement rate and even conversions.
- Convenience: The data often gets piped directly into your Google Analytics dashboard, so it's all in one place.
- Strategic Direction: Seeing exactly which terms drive sales can help you focus your efforts on high-value topics.
Limitations to Consider
- Accuracy: The matching is probabilistic—it's a highly educated guess. Vendors often claim accuracy rates between 80-95%, but it’s never going to be perfect.
- Cost: Most of these tools are subscription-based, which adds another line item to your marketing budget.
- Data Thresholds: They work best with more data. High-traffic sites give the algorithms more to work with, improving accuracy.
Comparing Different Keyword Recovery Methods
To help you decide which approach is right for you, here’s a quick comparison of the methods we've discussed for tackling the "(not provided)" challenge.
| Method | Accuracy | Complexity | Cost | Best For |
|---|---|---|---|---|
| Google Search Console | High (Aggregated) | Low | Free | Getting a reliable overview of performing queries and pages. |
| Landing Page Analysis | Moderate | Low | Free | Inferring intent for key pages and identifying content gaps. |
| Brand vs. Non-Brand Filter | High (for Segmentation) | Moderate | Free | Understanding audience sources and measuring content marketing ROI. |
| Third-Party Tools | Moderate to High (Estimated) | Moderate | Paid | Tying specific keyword data to on-site behaviour and conversions. |
In the end, choosing whether to invest in a paid tool comes down to your budget and how badly you need that granular data. For a big e-commerce site, finding just a handful of new high-converting keywords could pay for the subscription many times over. For a smaller business, the free insights from GSC and some clever landing page analysis might be all you need.
For a more complete strategy on identifying valuable terms, check out this ultimate small business SEO guide. It’s all about balancing the need for precision with the resources you have.
Bringing It All Together: Your Modern Keyword Performance Dashboard

Having all your performance data split between Google Analytics and Search Console just creates friction. Constantly flipping between browser tabs to stitch together a coherent story isn't just inefficient; it's a surefire way to miss critical insights. This is where we tie everything together.
The best way to truly adapt to the google analytics not provided keyword issue is by building a unified reporting dashboard. A tool like Google Looker Studio (what used to be called Data Studio) is perfect for this. It lets you pull in and merge data from both platforms, creating a single source of truth for your organic performance.
Instead of hunting for isolated metrics, you get a clear, complete picture, empowering you to make smarter SEO decisions based on the rich data you do have.
Designing a Dashboard That Actually Works
The goal here isn't to cram every possible metric onto a single screen. That just creates noise. A genuinely useful dashboard is designed to answer your most important SEO questions at a glance. It should tell a story.
I find the best approach is to structure the dashboard around a few core components. Think of them as the essential "widgets" that form the backbone of your organic reporting. This keeps you focused on what really moves the needle.
Here’s a simple, effective structure you can start with:
- Top Organic Landing Pages: A table pulled from Google Analytics showing your highest-traffic pages, along with key metrics like sessions, engagement rate, and conversions.
- Leading Search Queries: Right next to it, a table from Google Search Console showing the top queries driving clicks and impressions, complete with average position.
- Brand vs. Non-Brand Split: A simple scorecard or a time-series chart that visualises the split between branded and non-branded search traffic. This is brilliant for tracking new audience growth.
- Click-Through Rate by Device: A bar chart comparing CTR on mobile versus desktop. It’s a quick and easy way to spot potential user experience problems.
Your dashboard should be a living document, not a static report. Start with these fundamentals, but don't be afraid to add or remove components as your priorities shift. The best dashboards I've seen always evolve.
Hooking Up Your Data Sources
The real power of Looker Studio is how easily it connects to your Google properties. It’s a straightforward process: you’ll simply add your Google Analytics 4 property and your Google Search Console property as two separate data sources within your report.
Once they're connected, you can start blending the data. This is the game-changer. For example, you can create a single table that shows a landing page URL from GA right alongside the GSC queries that are driving impressions for that exact page. That’s a view neither platform offers on its own, and it's incredibly powerful for content optimisation.
Turning Data into Actionable Visuals
With your data sources connected and blended, the fun part begins: building your visualisations. The trick is to choose the right chart for the right job, making the data as easy to interpret as possible.
Practical Visualisation Examples
- The Landing Page & Query Table: Start by creating a blended data table. Use the "Landing Page" dimension from GA and the "Query" dimension from GSC. This immediately shows you which search terms are linked to your top-performing content, giving you a direct line of sight into user intent.
- The CTR vs. Average Position Scatter Plot: This is a fantastic way to spot low-hanging fruit. Plot "Average Position" on the X-axis and "CTR" on the Y-axis. Any queries that have a good position but a surprisingly low CTR are prime candidates for a quick title tag and meta description rewrite.
- The Monthly Organic Sessions Trend Line: Use a simple time-series chart to track your overall organic session growth from GA. I like to overlay it with annotations for key dates—like Google algorithm updates or major content launches—to add valuable context to any peaks or troughs.
Building a dashboard like this completely changes your relationship with your data. You stop being a reactive data-checker and become a proactive strategist. Moving beyond keywords and mastering these methods is fundamental to understanding how to measure overall SEO success. It’s the final step in moving past the limitations of "(not provided)" and into a new era of data-informed SEO.
Common Questions About Not Provided Keywords
Even when you get the hang of using tools like Search Console, the whole google analytics not provided keyword issue can still be a bit murky. It's a topic with a long history, so it's perfectly normal to have a few lingering questions. Let's clear the air and tackle some of the things that most often trip people up.
Getting your head around these fundamentals is a crucial part of building a solid marketing strategy for a small business. Without this clarity, it’s easy to waste time chasing outdated tactics or misinterpreting the data you’re actually seeing.
Why Do I Still Occasionally See Keywords in My Reports?
This one’s a classic head-scratcher. You’re told that virtually all organic keywords are hidden, but then you spot a few stragglers in your Google Analytics reports. What’s going on there?
The simple answer is that these are rare exceptions. They usually come from users on ancient web browsers or obscure search engines that don't automatically use secure (HTTPS) search. Think of them as digital fossils.
The number of these is almost always tiny—often less than 1% of your total organic traffic. So, while it’s a neat little quirk, it’s nowhere near enough data to base any real decisions on.
Do VPNs or Incognito Mode Affect Not Provided Data?
This question comes up a lot, but the answer is surprisingly straightforward. VPNs and incognito browsing don't actually cause the "(not provided)" problem. The real reason is, and always has been, Google's universal switch to secure HTTPS search.
Whether someone is using a VPN, browsing in incognito mode, or just searching normally, their query is encrypted the moment they hit "enter" on Google. That keyword data gets stripped away long before the visit is ever recorded in your Analytics account. These privacy tools just add extra layers of anonymity; they don't change the core mechanic that hides the keywords.
The key takeaway is this: the "(not provided)" situation is a universal feature of Google Search, independent of a user's personal privacy settings like VPNs or private browsing modes. It affects all organic traffic from Google.
Is This a Problem That Will Ever Be Fixed by Google?
In a word: no. It's really important to stop thinking of "(not provided)" as a bug or some temporary issue that Google needs to fix. From Google's point of view, it’s a permanent privacy feature. That decision to encrypt all search queries was made over a decade ago, and it was a one-way street.
There's practically zero chance of this policy being reversed. The entire internet has shifted towards a privacy-first model, and undoing this would be a massive step backwards. Instead of waiting for a fix that’s never going to arrive, your best bet is to fully embrace the workarounds we’ve been discussing, like digging into Google Search Console and analysing your landing page performance.
Can Internal Site Search Data Replace Organic Keywords?
Tapping into your website's own internal search data is a brilliant move. It gives you direct insight into what your current visitors are looking for once they're already on your site, helping you spot content gaps and learn the exact phrases your audience uses.
But it’s not a like-for-like replacement for organic keyword data. Internal search reveals what an already-engaged user wants to find, whereas organic keywords showed us what a complete stranger was looking for when they discovered you. They answer two very different, but equally important, questions about user intent.
- Organic Keywords: Revealed discovery intent (top of the funnel).
- Internal Search: Reveals exploration intent (middle or bottom of the funnel).
The smart approach is to use both data sources together. They combine to give you a much richer, more complete picture of the entire user journey.
At The Digital Marketing Toolbox, we bring together the best resources to help you master modern marketing challenges. Discover and compare top-tier tools for everything from SEO to AI content creation, all in one place. Find your next growth solution at https://grow-your-biz.com.


