

To get a real handle on your marketing's performance, you need to tie your marketing goals directly to what actually matters for the business—things like growing revenue or bringing in new customers. It's about moving past vague metrics like website traffic and setting firm, measurable targets. Think "increase marketing qualified leads by 20%," not just "get more leads." This is how you prove marketing is a revenue driver, not just a cost centre.
Aligning Marketing Goals with Business Reality

Before you even think about tracking a single click or impression, you have to stop and define what success actually looks like for your business. It's a common trap: marketing teams get bogged down measuring activities that don't contribute to the bottom line. Why? Because their goals are often completely disconnected from the company's financial reality.
Effective measurement starts by asking one simple, powerful question: "What business outcome is this marketing activity supposed to influence?" Without a solid answer, you’re just collecting data for the sake of it, not unearthing genuine insights.
From Vague Targets to Specific Objectives
This is where the magic happens. Moving from fuzzy, generic targets to sharp, specific objectives is what elevates your marketing from a purely tactical function to a strategic one. A goal like "increase brand awareness" is a classic example of something that's nearly impossible to measure in a meaningful way.
A well-defined objective, on the other hand, gives you a clear benchmark for success.
For instance, forget "more social media engagement." A much stronger goal would be to "drive 50 qualified demo requests per month through our LinkedIn content campaign." See the difference? This target is specific, measurable, and directly linked to a business outcome—creating sales opportunities. For a deeper dive into this, our guide on building a solid marketing strategy for small business offers some great context.
The most powerful shift you can make is to frame every marketing goal in the language of business results. This changes the conversation from "How many likes did we get?" to "How much pipeline did we generate?" and secures marketing's seat at the strategic table.
Establishing a Measurement Framework
Once your objectives are crystal clear, it’s time to build a framework to track your progress. Don't overcomplicate it. This isn't about building a monstrously complex dashboard; it's about pinpointing the handful of metrics that truly reflect success for each specific goal.
A solid framework should connect the dots like this:
- Primary Business Objective: The big-picture company goal. For example, increase overall company revenue by 15%.
- Specific Marketing Goal: How marketing will help get there. For instance, generate £250,000 in new sales pipeline from organic search.
- Key Performance Indicators (KPIs): The specific numbers you'll watch. This could be the number of marketing qualified leads (MQLs), your MQL-to-customer conversion rate, or the average deal size from organic leads.
This structure forces every metric you monitor to have a clear purpose. It stops you from getting side-tracked by vanity metrics and keeps the team focused on work that delivers tangible value. Getting this alignment right is the non-negotiable first step. It's how you'll finally demonstrate marketing's true contribution, justify your budget, and prove its role as a key engine for growth.
Choosing Metrics That Actually Matter
Ever feel like you’re drowning in data but starving for insights? It’s a classic problem. The secret to effective measurement isn't tracking every metric under the sun. It's about being ruthless and focusing only on the Key Performance Indicators (KPIs) that genuinely show your impact on the business. We need to separate the real deal from the "vanity metrics."
A vanity metric, like the number of social media followers you have, might look good on a report and give you a warm, fuzzy feeling, but it doesn't tell you a thing about how much money your marketing is actually making. A meaningful metric, on the other hand, like Customer Acquisition Cost (CAC), draws a straight line from your marketing spend to a real business result.
Distinguishing Vanity from Value
The real test is simple: can you make a strategic business decision based on the number? Knowing your email open rate is 30% is interesting, but it's not the full story. It’s a supporting metric—a clue that your subject line probably worked well.
What really matters is knowing your email’s click-through rate on the main call-to-action was 4%, which resulted in 50 demo sign-ups. Now that is valuable. This data tells you the campaign successfully nudged people towards a purchase, giving you a clear signal to either pour more fuel on that fire or replicate what worked in the next campaign.
Your dashboard shouldn't be a data graveyard. It should be a concise, powerful story about what's working and what isn't. If a metric doesn't help you make a decision, seriously question why you're tracking it.
This shift towards tangible results isn't just a good idea; it's becoming standard practice. The latest data shows that for 2025, UK businesses are zeroing in on metrics that directly prove marketing's contribution to the bottom line. Sales outcomes are the top metric for 22% of businesses, with social media engagement close behind at 20% and website traffic at 18%. What’s really telling is that 54% of businesses list increasing sales revenue as one of their top three priorities, showing a clear move towards performance-driven measurement. You can dig deeper into the UK marketing priorities data to see how this trend is shaping strategies across the country.
The image below gives you a quick look at some of the core KPIs businesses lean on to see how they're doing.
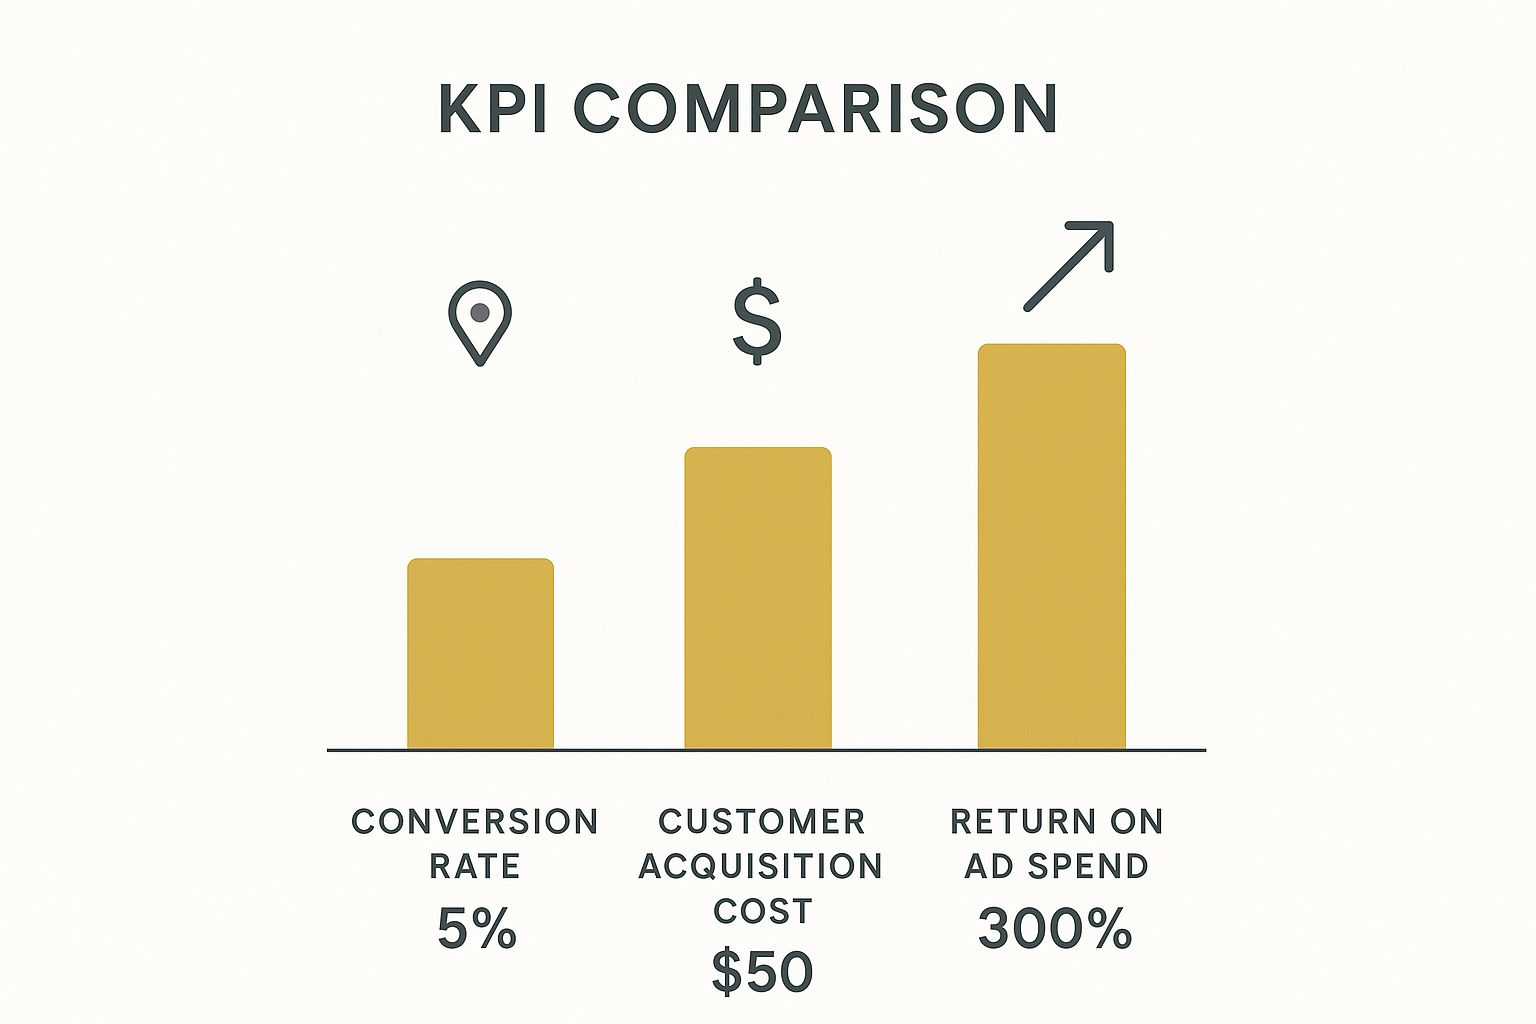
As you can see, metrics like these provide a snapshot of campaign health, from how efficiently you're spending (CAC) to how profitable your efforts are (ROAS).
Matching Metrics to Your Marketing Channels
Not all channels are built the same, so your measurement approach can't be one-size-fits-all. Trying to apply the exact same KPIs to SEO, paid social, and email marketing will just muddy the waters. Each channel plays a unique role in the customer journey and needs its own primary and secondary metrics.
To give you a clearer picture, here's a breakdown of primary and secondary KPIs for some of the most popular marketing channels. This helps you focus on what truly indicates success versus what just supports it.
Channel-Specific KPIs for Measuring Effectiveness
| Marketing Channel | Primary KPI (Direct Impact) | Secondary KPI (Supporting Metric) |
|---|---|---|
| Search Engine Optimisation (SEO) | Organic-driven MQLs or Sales | Keyword Rankings, Organic Traffic, Backlink Velocity |
| Paid Social (e.g., LinkedIn Ads) | Cost Per Lead (CPL) or ROAS | Click-Through Rate (CTR), Impressions, Engagement Rate |
| Content Marketing (Blog) | New Email Subscriber Conversions | Time on Page, Bounce Rate, Social Shares, Scroll Depth |
| Email Marketing | Conversion Rate on CTA | Open Rate, Click-Through Rate (CTR), Unsubscribe Rate |
Thinking about your channels this way helps you cut through the noise.
For instance, with SEO, your main goal might be to generate organic-driven MQLs (Marketing Qualified Leads). Sure, you'll watch things like keyword rankings and traffic, but those are secondary. They support the main goal, but the number of actual leads is what moves the needle.
Likewise, for a paid social campaign on a platform like LinkedIn, you're probably obsessed with Cost Per Lead (CPL) or Return on Ad Spend (ROAS). The other metrics—CTR, impressions, engagement—are diagnostic tools that help you figure out why your CPL is what it is.
When you build a focused dashboard that prioritises the right metrics for each channel, you stop guessing and start making confident, data-backed decisions. You can finally tell a clear story about what’s actually driving results.
Building Your Marketing Analytics Stack

Now that you know what to measure, let's talk about how. Assembling your marketing analytics "stack" sounds far more intimidating than it actually is. It’s simply about picking the right tools for the right job, and you don’t need a massive budget to get started.
In my experience, most businesses can get a fantastic grasp of their performance with just a handful of free or low-cost platforms. These are the workhorses that give you a surprisingly clear picture without needing a huge investment.
The Essential Toolkit
You can go a long way with a few core tools. They'll handle the heavy lifting and show you what's working and what isn't across your main channels.
- Website Analytics: Google Analytics 4 (GA4) is the absolute cornerstone. It’s non-negotiable. This is where you’ll see who's visiting your site, how they got there, and what they do once they arrive.
- Social Media Insights: Every platform has its own built-in analytics. Tools like the Meta Business Suite or LinkedIn’s native analytics provide vital data on reach, engagement, and who your audience is.
- Email Performance: Your email marketing platform, whether it’s Mailchimp or ActiveCampaign, will have its own dashboard. This is your go-to for tracking open rates, click-throughs, and crucially, the sales and leads your campaigns are generating.
These platforms are the foundation of any solid measurement strategy. For anyone just starting to piece this all together, we have a helpful beginner's guide to digital marketing that dives deeper into these areas.
I see so many people searching for a single, all-in-one tool that does everything. The truth is, a well-integrated stack of specialised tools nearly always provides a richer, more accurate picture of what's really going on.
Connecting the Dots with UTM Parameters
This is where you go from guessing to knowing. How can you be certain that a new lead came from a specific LinkedIn post versus your weekly email newsletter? The answer: Urchin Tracking Module (UTM) parameters.
Think of them as little notes you attach to your links. These simple tags tell your analytics tools precisely where each visitor came from, creating a digital breadcrumb trail from their first click right through to a purchase or sign-up.
Let's imagine you're a B2B company promoting a new webinar with a LinkedIn ad. The URL in that ad could look something like this:
yourwebsite.co.uk/webinar-signup?utm_source=linkedin&utm_medium=cpc&utm_campaign=q3_webinar
When someone clicks, GA4 instantly knows this visit came from a paid campaign (cpc) on LinkedIn. This simple tag allows you to see exactly how many webinar sign-ups that specific ad drove.
Getting into the habit of using UTMs for every single campaign is probably the most important thing you can do for accurate tracking. It’s what turns your analytics from a vague overview into a detailed, actionable report card for everything you do.
From Data Overload to Actionable Insights
Collecting marketing data is surprisingly easy these days. The real challenge? Turning that mountain of numbers into smart, profitable decisions. You’ve got the reports and dashboards, but what story are they actually telling you? This is where we move beyond surface-level reporting and start uncovering the ‘why’ behind the ‘what’.
Looking at overall traffic or conversion rates can be genuinely misleading. The magic happens when you start segmenting your data to understand how different groups of people behave. A flat traffic trend might be hiding a massive win—like a specific blog post that’s converting organic visitors at a ridiculously high rate. Finding that insight is gold.
Digging Deeper with Segmentation
Your analytics platform, whether it’s Google Analytics or something similar, is a treasure trove if you know where to look. Instead of just viewing ‘all users’, you need to create segments to isolate and compare specific groups. This is how you spot hidden opportunities.
For instance, you could segment your audience by:
- Traffic Source: Pit users from organic search against those from paid social and email newsletters. You might discover that while paid ads bring in the volume, your email subscribers have a 3x higher conversion rate.
- Device Type: Is your mobile experience letting you down? Segmenting by device can quickly reveal if your site is frustrating mobile users and costing you sales.
- New vs. Returning Visitors: Understanding the journey for both groups is crucial. Are new visitors bouncing straight away, or are your returning users easily finding what they need to make a purchase?
By slicing up your data like this, you go from vague observations to specific, actionable points. You can now confidently say, “We need to sort out the mobile checkout process,” instead of just, “Our sales are down.”
Combining the ‘What’ with the ‘Why’
Numbers tell you what happened, but they rarely tell you why. For the complete picture, you have to blend your quantitative data with qualitative feedback. This gives you a proper 360-degree view of your marketing performance.
Let’s say your analytics show a high cart abandonment rate. That’s the ‘what’. To get to the ‘why’, you need to dig into the human side of things:
- Customer Surveys: Ask recent customers what nearly stopped them from buying.
- Sales Team Feedback: Your sales team is on the front line, talking to potential customers all day. They know the common objections and points of confusion inside-out.
- On-page Analytics: Tools like heatmaps show you exactly where users are clicking—or where they aren't—which can instantly reveal design flaws or confusing navigation.
Fusing hard data with human stories is the key to unlocking powerful insights. The numbers point you in the right direction, but the feedback tells you what to do when you get there.
This blended approach is absolutely vital in fast-moving channels like social media. The UK social media advertising market is a huge piece of this puzzle, projected to hit £9.95 billion by 2025. That figure includes a massive £1.04 billion spent on influencer marketing, where authenticity and engagement are everything.
Analysing social metrics gives you crucial quantitative data, but it’s understanding the conversations and community dynamics—the qualitative side—that truly helps UK marketers refine their campaigns. You can explore more about UK social media trends to see how this is shaping modern strategies.
Connecting Marketing Efforts to Revenue

Right, this is where the rubber meets the road. It’s time to translate all your hard work—the campaigns, the content, the clicks—into the one language the boardroom truly understands: money. Forget vanity metrics like 'likes' or 'impressions'. To really prove your value, you need to draw a clear, undeniable line from your marketing spend directly to the company's bottom line.
This is how marketing stops being seen as a cost centre and starts being recognised as a powerful engine for growth. And it’s not as complicated as it sounds. It all comes down to a few core financial metrics that every business leader gets. Master these, and you'll have the confidence to defend your budget and showcase your team's real-world impact.
Calculating Your Financial Impact
So, how do we measure what really matters? It boils down to three essential calculations. Think of them as a financial toolkit for your marketing department; together, they paint a complete picture of your performance.
- Return on Investment (ROI): This is the ultimate yardstick for profitability. The formula is simple: (Revenue – Marketing Cost) / Marketing Cost. An ROI of 4:1 means you're generating £4 in revenue for every £1 spent. It’s the final word on whether a campaign was a financial success.
- Customer Acquisition Cost (CAC): This tells you exactly how much it costs, on average, to bring a new paying customer through the door. To work it out, just divide your total marketing spend by the number of new customers you gained during that period. A low CAC is a clear sign of efficient, well-targeted marketing.
- Customer Lifetime Value (CLV): This is a forward-looking metric. It predicts the total amount of revenue you can realistically expect from a single customer over the entire course of their relationship with your business. Knowing your CLV is critical because it tells you how much you can afford to spend on CAC and still remain profitable.
These three metrics don't live in isolation; they tell a story together. A high CLV, for instance, might justify a higher CAC, giving you the green light to invest in more competitive—and often more expensive—channels. We delve deeper into channel-specific strategies, and you can explore the advantages of email marketing in our dedicated guide.
The goal is beautifully simple: your CLV must be significantly higher than your CAC. A healthy ratio, often cited as 3:1 or more, is the hallmark of a sustainable business. It proves your marketing is driving profitable growth, not just acquiring customers at any price.
Choosing the Right Attribution Model
Attribution is all about giving credit where credit is due. Which marketing touchpoints actually influenced a customer to convert? It sounds straightforward, but the modern customer journey is anything but a straight line. People bounce between channels—they might see an ad, read a blog, get an email, and then finally click a social media link before buying.
This complexity is why omnichannel marketing has become so effective for UK businesses. In fact, companies that use an integrated approach are seeing a 90% higher customer retention rate compared to those sticking to a single channel. This blend of digital and physical touchpoints makes choosing the right attribution model more important than ever.
The model you pick really depends on your business and, crucially, the length of your sales cycle.
- First-Touch: This model gives 100% of the credit to the very first interaction a customer had with your brand. It’s brilliant for understanding which channels are best at generating initial awareness.
- Last-Touch: The opposite of first-touch, this gives all the credit to the final click before a conversion. It's simple to track but often gives a skewed picture, ignoring all the hard work that came before.
- Multi-Touch (e.g., Linear or Time-Decay): This is a more balanced approach that spreads the credit across multiple touchpoints in the customer's journey. It provides a far more holistic and realistic view of how your different channels are working together to nurture a lead from discovery to decision.
For any business with a considered purchase or a longer sales cycle, a multi-touch model is almost always the way to go. It properly values your top-of-funnel content and mid-funnel nurturing campaigns, ensuring that the final click doesn't get all the glory.
Right, so you've got your measurement framework in place. You know what you should be doing. But when the rubber meets the road, things can get a bit messy. Let's walk through some of the most common questions and sticky situations that pop up when you start measuring your marketing in the real world.
One of the first things people ask is, "How often should I actually be looking at this stuff?" There’s no single right answer here – it completely depends on what you're measuring.
For something fast-paced like a Google Ads campaign, you’ll want to be checking in daily, or at least every couple of days. Budgets can get eaten up quickly, and a small tweak can make a huge difference. On the other hand, for bigger, slower-burn strategies like content marketing or SEO, a monthly or even quarterly check-in is much more sensible. You need to give those channels time to breathe and let the trends emerge from the daily noise.
A classic mistake is applying the same reporting schedule to everything. This causes panic over slow channels and missed opportunities on fast ones. It’s far better to match your reporting cadence to the natural pace of the channel you're measuring.
What About the Really Tricky Stuff?
Okay, let's get into the more complex scenarios. What happens when a sale takes months to close? How do you give proper credit to that first blog post someone read six months ago? This is exactly where last-touch attribution falls apart.
For businesses with long sales cycles, you need a more sophisticated view. A multi-touch model, like a time-decay model, is a great option. It gives more weight to the touchpoints closer to the sale, but it doesn't forget about those crucial early interactions that started the whole journey.
Then there's the age-old problem of measuring brand awareness. These campaigns aren't designed for immediate clicks and sales, so how do you know if they're working? You have to look for the ripples, not the splash. Focus on proxy metrics that signal your brand's growing influence:
- Direct Traffic: Are more people typing your website address straight into their browser? That's a fantastic sign they remember you.
- Branded Search Volume: Is the number of people searching for your company name on Google going up? This shows your brand recall is improving.
- Social Mentions and Engagement: Are you seeing more organic chatter and interaction around your brand online?
These are tangible signs that your brand-building efforts are paying off, even if they don't lead directly to a sale that day.
Choosing the Right Tools Without Breaking the Bank
Finally, the big question for many: "What tools do I need, and can I afford them?" The good news is you don't need a massive, enterprise-level software suite to get started. You can build a surprisingly powerful and cost-effective setup with just a few key tools.
Your absolute, non-negotiable starting point is Google Analytics 4. It’s free, it’s powerful, and it's the foundation for understanding what’s happening on your website. Pair that with the built-in analytics from your social media accounts and your email marketing platform. For most small businesses, this simple toolkit gives you more than enough insight to make genuinely smart decisions about your marketing budget.
Ready to stop juggling dozens of tools and start making smarter decisions? The Digital Marketing Toolbox centralises the best platforms for analytics, SEO, and more, helping you build a powerful measurement stack without the guesswork. Find the right tools for your business at https://grow-your-biz.com.


